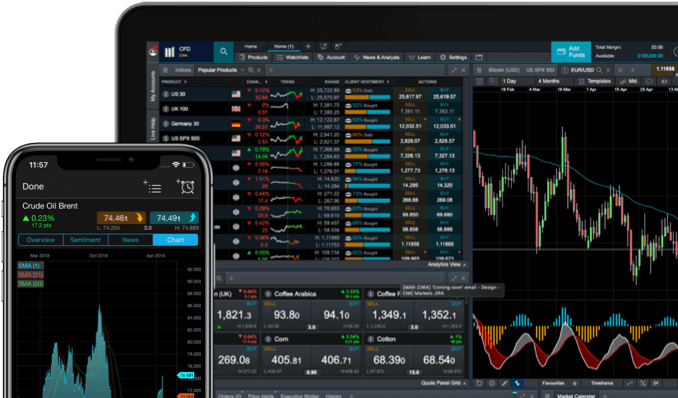
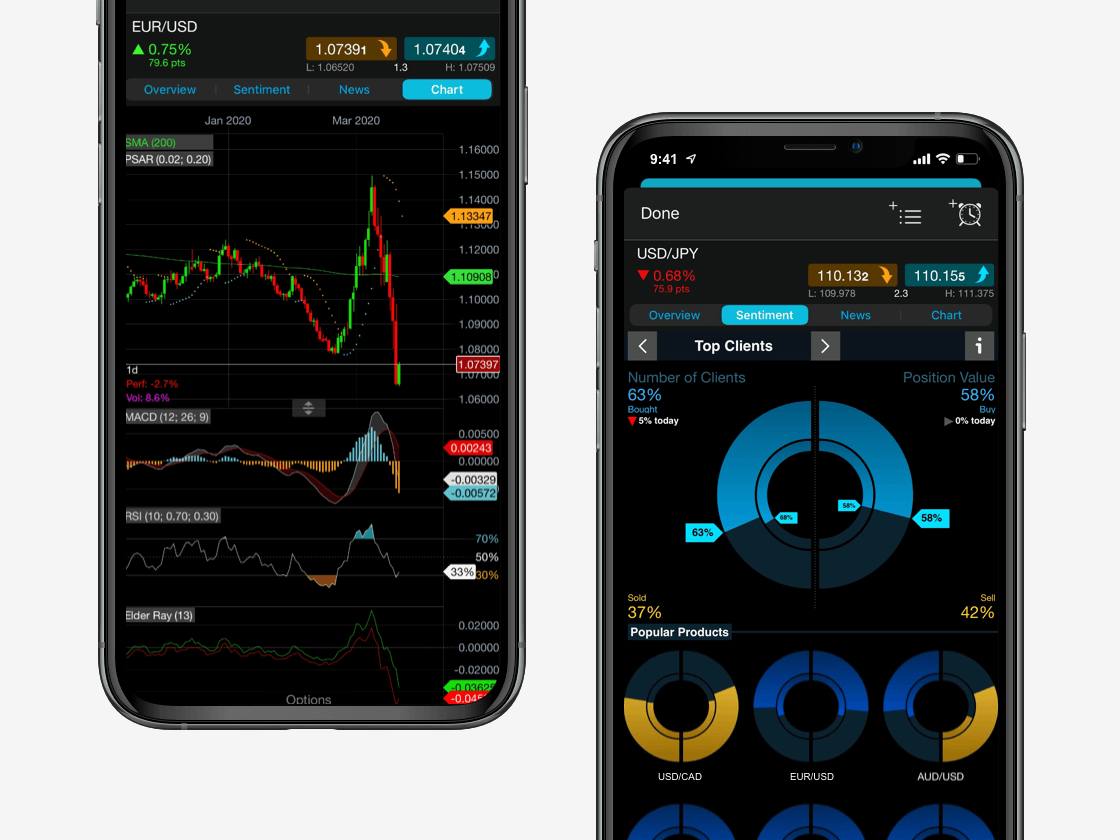
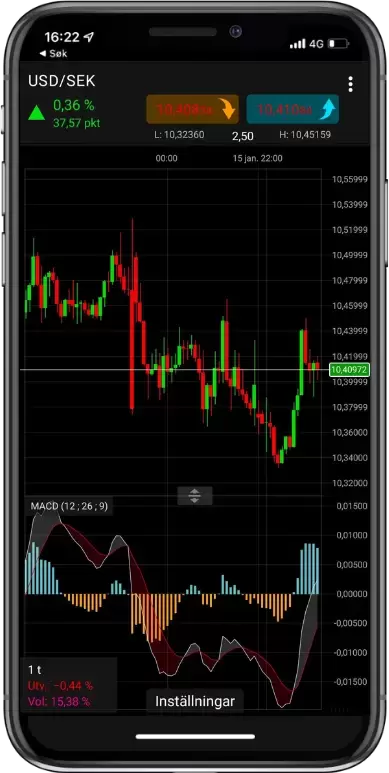
There are over 40 recognised forex candlestick chart patterns in total. We explain eight of the most popular candlestick pattern examples below:
White/Black Marubozu
Black marubozus
Black marubozus are significant candlestick patterns that give valuable insight into selling pressure. Black marubozus are rectangular candlesticks with little or no shadow at the top or bottom. Black marubozus indicate selling pressure in a market and show that bears were calling the shots from the opening bell until the closing bell on the day. Black mazubozus are especially valuable around significant resistance levels and may indicate that a potential price level is about to be hit.
White marubozu
White marubozus are similar to their black counterparts, but indicate that prices are being controlled by buying pressure. White marubozus are rectangular blocks with very little or virtually no shadows at the top or bottom. White marubozus most commonly indicate continuation in an uptrend, while in a downtrend they can indicate that a potential trend reversal could occur.
Doji
Doji, or crosses, are usually made up of a single candlestick and they show that the opening and closing price of a candlestick is virtually the same. Most doji candlesticks resemble crosses or inverted crosses, or plus signs. In technical analysis, dojis usually represent neutrality, meaning that the trend is likely to continue. The shadows, or wicks on a doji are an important indicator of market sentiment. For example, if the shadow at the top of the candlestick is long, it means that investors tried to push the price higher, but failed, while a longer shadow at the bottom indicates the presence of selling pressure.
Engulfing pattern (bullish/bearish)
Engulfing candlestick patterns (bullish/bearish) signify a potential reversal in trend and are indicated by a large candlestick extending higher and lower than (literally engulfing) the previous candlestick. The larger the size of the engulfing candlestick, the more significant it is to analysts. A black engulfing candlestick represents a potential bearish reversal during an uptrend, while a white engulfing candlestick could indicate that a bullish reversal is about to occur in a downtrend.
Hammer
A common bullish reversal pattern, hammers indicate that an uptrend is likely to occur. As the name suggests, hammers have a short body, with a shadow or wick that is twice as long at the bottom. When the high and close are the same, it indicates the formation of a bullish candlestick pattern, meaning that while bears tried to push prices lower, buying pressure from the bulls pushed up prices, with prices eventually closing at the same level as the day's high. Hammers where the open is the same as the high are considered less bullish but indicate a possible bullish trend nevertheless.
Shooting star
Shooting stars look a lot like inverted hammers (above) and indicate that a bearish reversal is about to occur. Shooting stars are created when the low, open and close of the day are close to each other, with the day's high located high above, forming atleast twice the length of the body of the candlestick. When the low and closing prices are the same, a shooting star is considered more significant as it indicates that bulls tried to push prices higher but were overpowered by the bears and prices eventually closed at a similar level to where they opened. Can sometimes look like a gravestone doji.
Three-line strike
The three-line strike pattern refers to three white candlesticks occurring on a daily chart three days in a row, indicating that prices closed higher for three simultaneous days. Three-line strikes usually occur at the end of a downtrend and may, therefore, indicate that a reversal might be in order.
Three black crows
Three-black crows are a common reversal indicator in an uptrend and are indicated by three black consecutive candlesticks on a daily chart where the closing prices were lower than the opening price of the day. Formed of three consecutive black candlesticks with long bodies, these indicate the lack of buying conviction in the market which allowed bears to successfully push prices lower.
Evening star
Evening star patterns usually occur at the top of an uptrend and signify that a trend reversal is about to occur. Evening stars consist of three candlesticks, with the first candlestick having a significantly large green or white body, indicating that prices closed higher than the opening level. The second candlestick opens higher after a gap, meaning that there is continued buying pressure in the market. The second candlestick in an evening star pattern is usually small, with prices closing lower than the opening level. The third and final candlestick in an evening star opens lower after a gap and signifies that selling pressure reversed gains from the first day's opening levels.


