Spread bets and CFDs are complex instruments and come with a high risk of losing money rapidly due to leverage. 69% of retail investor accounts lose money when spread betting and/or trading CFDs with this provider. You should consider whether you understand how spread bets, CFDs, OTC options or any of our other products work and whether you can afford to take the high risk of losing your money.

What is a dead cat bounce and how do you identify it?

A dead cat bounce is a popular term that describes a common charting pattern involving a short-lived rally in a down-trending asset. It’s an important chart pattern that all traders and investors should know, as it frequently occurs when an asset’s price is falling. Discover what the pattern looks like, how long it lasts and how to trade it, including dead cat bounce strategies.

What is a dead cat bounce?

A dead cat bounce is defined as an asset, such as a stock, that sees a temporary recovery after a substantial downtrend. The meaning behind a dead cat bounce is that the rally is likely to be short-lived since the stock is in an overall downtrend.

In short, a dead cat bounce is a bearish continuation pattern. When the stock price is dropping, the price rises temporarily but then resumes its downward trajectory. This technical analysis chart pattern can occur in any time frame since downtrends can occur at any point. You’ll hear the term most often associated with popular stocks or stock market index ETFs, usually based on daily charts since this is what many investors, analysts and news sources are watching.

Traders and investors lookout for this chart pattern as it may indicate the future short-term direction​ of an asset. However, passive investors may not concern themselves with these types of short-term price fluctuations as they are invested for the long-term, so this pattern is more relevant to short/medium term traders.

Where did the term come from?

The term first began to circulate in the 1980s. Many believe it was coined by Raymond DeVoe Jr, a Wall Street analyst and value investing newsletter writer. He warned investors about the pattern of a short-term upward move in an otherwise declining stock.

According to the Boston Globe​, he gave the analogy that a dead cat dropped from a building may bounce a little, but the cat is still dead.

What does a dead cat bounce look like?

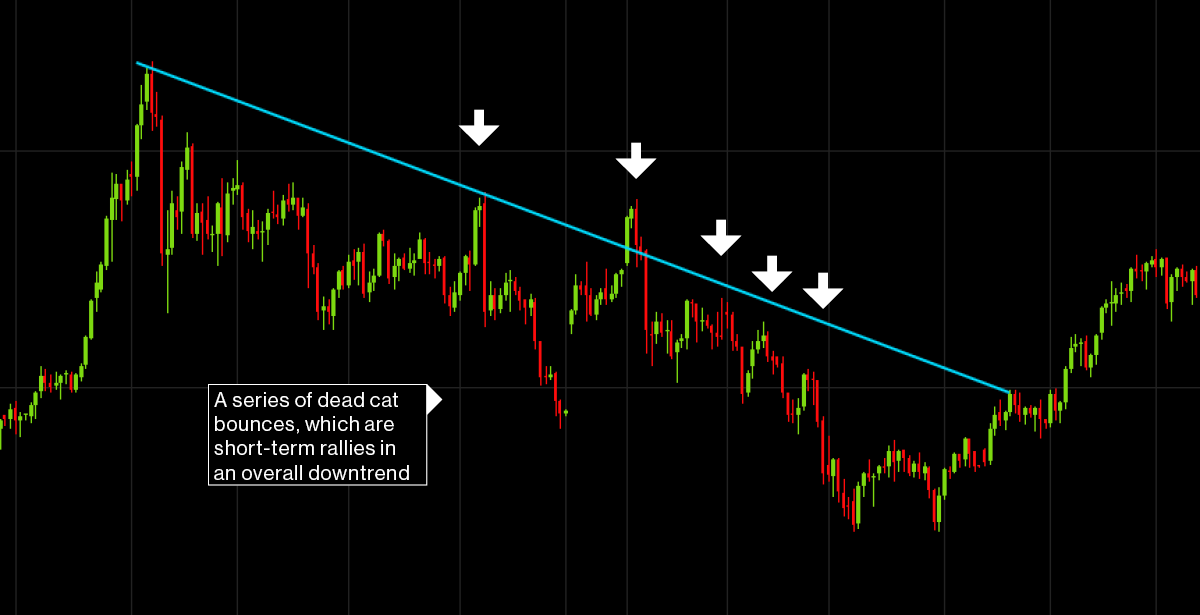
The charting pattern is composed of three main traits. A downtrend, a rally or pullback against the trend, followed by the price rolling over and starting to drop again.

The best way to learn how to spot it is to review the charts of stocks or other assets that are in downtrends. Those brief rallies interspersed between declines are what defines the pattern.

For example, below is a chart tracking the performance of gold in late 2020 and early 2021 that features multiple examples.

There is no rule for how long the price should drop before the short-term rallies are considered dead cat bounces. But the price must be in a downtrend, which means the price has been dropping below prior lows, and rallies are staying below prior highs.

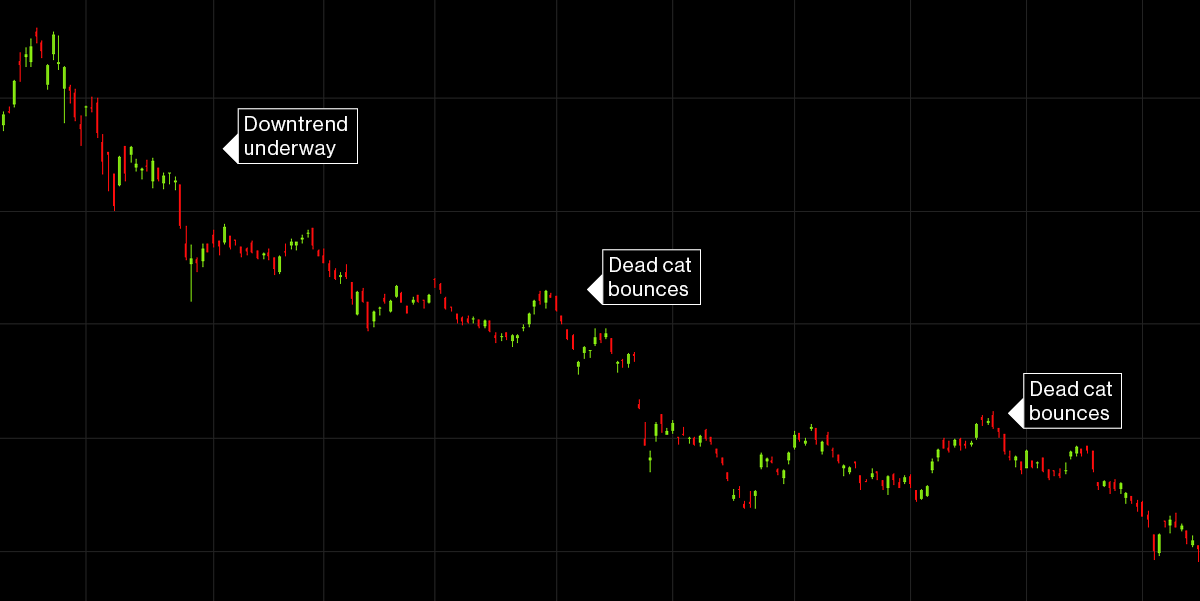
Dead cat bounces also occur in ETFs or share baskets, which are composed of many stocks. For example, our China Tech share basket shows a long-term downtrend as the Chinese government cracked down on big technology companies in 2021 with anti-monopoly legislation and fines.

How long does a dead cat bounce last?

The pattern can occur during any time frame. However, often rallies are short-lived, spanning across three to 15 price bars in technical analysis charts. If viewing a daily chart, that means three to 15 days. This is a guideline, as each bounce is different.

The example charts above are a good illustration of this. Some bounces lasted only several days, while others lasted a couple of weeks — but none of the bounces lasted longer than that. When a bounce does endure, it may be a reversal.

Explore our platform's range of charting features, technical indicators, chart patterns and draw tools

What are some strategies for trading this pattern?

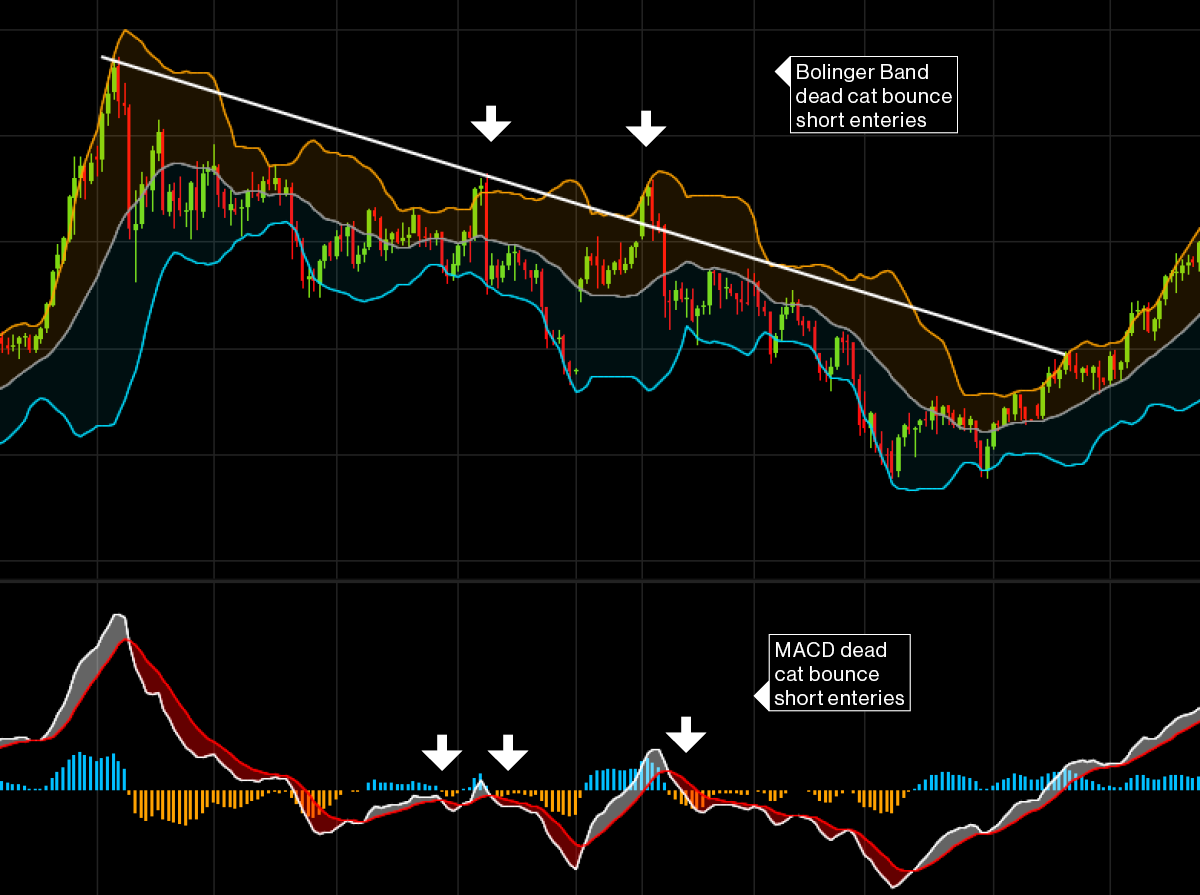
A dead cat bounce is a trend-following strategy​, as traders are likely to enter short trades as the price starts dropping following the bounce. There are a number of technical indicators and price action-based dead cat bounce strategies to consider, including:

  • Entering short positions on a dead cat bounce when the price reaches the upper Bollinger Band​ and then falls away from it.

  • Entering shorts on a moving average convergence divergence (MACD) crossover. This occurs when the MACD crosses below the signal line from above.

The following gold chart shows these entry signals.

Some traders prefer using price action over indicators. Here is a method to consider when entering a dead cat bounce chart pattern:

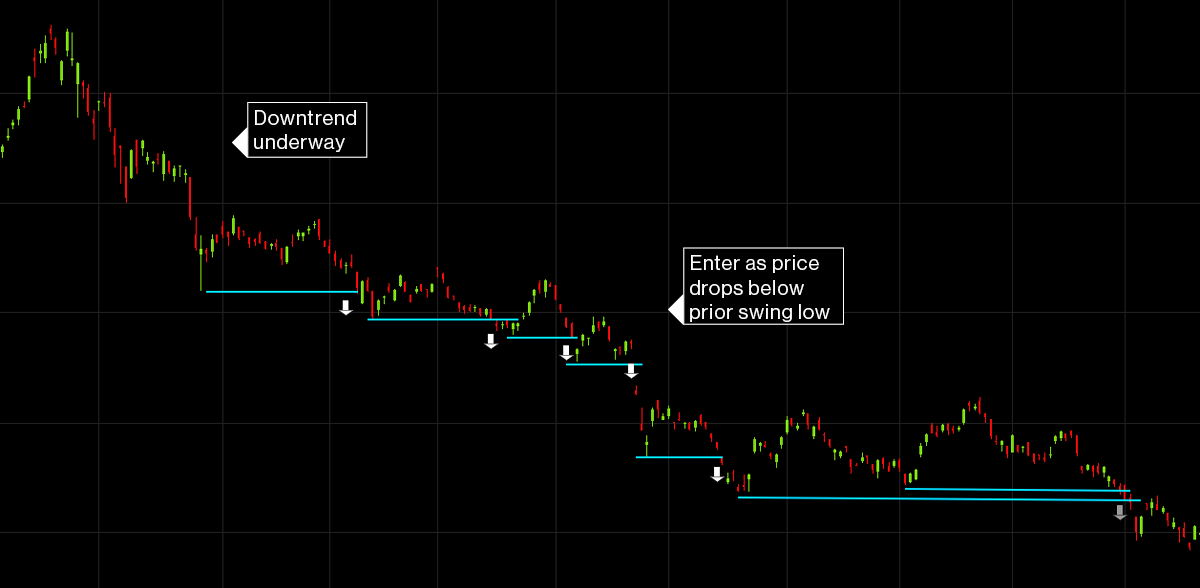
  • A trade could enter a short position when the price moves below a prior swing low. This shows that the price is once again moving down, in alignment with the overall downtrend.

The following China Tech Share Basket chart shows how the entries would look for this dead cat bounce trading strategy:

With all strategies, risk-management is important because it is unknown whether the price will keep falling or at what point the price will start rising again. To control risk, you could consider utilising a stop-loss order​, which exits the trade if the price doesn’t move as expected. Consider placing a stop loss above the recent swing high that occurred just prior to entry.

Also, keep position sizes manageable. Professional traders tend to lose 2% or less of their account on each losing trade. The combination of position size and the stop loss keeps any losses to a small portion of the account.

Dead cat bounce vs market reversal

There are some key differences between a dead cat bounce and a market reversal. Differentiating between the two is part of learning how to trade stocks​.

A dead cat bounce is short-lived, usually three to 15 price bars as a guideline. However, if the price is rallying for 20 days or more, this could indicate prolonged buying, which could signal a reversal.

In addition to the duration of the rally, also watch magnitude. A large upward price move that goes above prior swing highs indicates that a reversal could be underway. On the other hand, an uptrend is created by a series of rising swing highs and rising swing lows. For example, the price moves above a prior swing then drops but stays above the prior swing low, and then moves back above the swing high. That indicates that the asset is on an uptrend but that a reversal is underway.

Also, consider a bull trap​ versus a dead cat bounce. A bull trap is when the price moves above a prior swing high or above a resistance area, only to quickly reverse to the downside. This traps traders and investors who thought the downtrend was reversing into an uptrend. Therefore, this pattern can turn into a bull trap if the bounce is strong, but the price fails to continue higher after breaking through the prior high/resistance.

FAQs

What is the opposite of a dead cat bounce?

An inverted dead cat bounce is the opposite of a dead cat bounce charting pattern. It looks similar but occurs in an uptrend.

What are some other interestingly named investing terms?

Candlestick chart analysis is filled with interesting names, including gravestone doji, three white soldiers, three black crows, morning star and hanging man. Hawkish, for example, is when interest rates are expected to rise, and dovish is when they are expected to go lower. Bearish is when prices are falling, or someone expects a price to fall. Bullish is when prices are rising, or someone expects a price to rise.


CMC Markets is an execution-only service provider. The material (whether or not it states any opinions) is for general information purposes only, and does not take into account your personal circumstances or objectives. Nothing in this material is (or should be considered to be) financial, investment or other advice on which reliance should be placed. No opinion given in the material constitutes a recommendation by CMC Markets or the author that any particular investment, security, transaction or investment strategy is suitable for any specific person. The material has not been prepared in accordance with legal requirements designed to promote the independence of investment research. Although we are not specifically prevented from dealing before providing this material, we do not seek to take advantage of the material prior to its dissemination.

Ready to find your flow?

start trading with a live account or
Try a demo with £10,000 of virtual funds.