Bollinger Bands
Bollinger Bands® are a popular technical analysis tool that indicates whether an instrument's price is high or low on a relative basis. Invented by John Bollinger in the 1980s, Bollinger Bands can be applied to a variety of different financial instruments. These include indices, currencies and stocks.
As a technical indicator, Bollinger Bands show when an instrument is in overbought or oversold territory. If the instrument's price moves towards the upper band, this is usually a signal that it is overbought. If the price moves towards the lower band, this usually signals that it is oversold. They can also be used to assess volatility. During calm trading periods, the bands will narrow. When price movements are volatile, the bands will widen. Bollinger Bands are one of the most commonly-used technical analysis tools. When combined with other indicators, they can help traders to profit from overbought and oversold conditions in the market.
What are Bollinger Bands?
Bollinger Bands are a technical analysis indicator that can be used to determine whether an instrument is overbought or oversold within the financial markets, and it can also be used to assess volatility. Bollinger Bands consist of three lines on a trading chart. The middle line of the indicator is the simple moving average (SMA) of the instrument's price, which is the average of the price over a certain length of time. This is generally set to a 20-day period. The upper band is the SMA plus two standard deviations. The lower band is the SMA minus two standard deviations.
Either side of the SMA is a Bollinger Band. Bollinger Bands look like an envelope around the price of the instrument. The widths of the bands are determined by the standard deviation. Standard deviation refers to the volatility of the instrument's price movements. This is generally set to 2.0.
Bollinger Band calculation formula
The period is the number of intervals that are included in the Bollinger Band calculation. A setting of (20, 2) means that the period and standard deviation are set to 20 and 2.0, respectively. For Bollinger Bands with a setting of 20, 2, the bands are calculated according to the following formulas:
Upper band = 20-day SMA + (20-day standard deviation x 2)
Lower band = 20-day SMA – (20-day standard deviation x 2)
Bollinger Bands chart
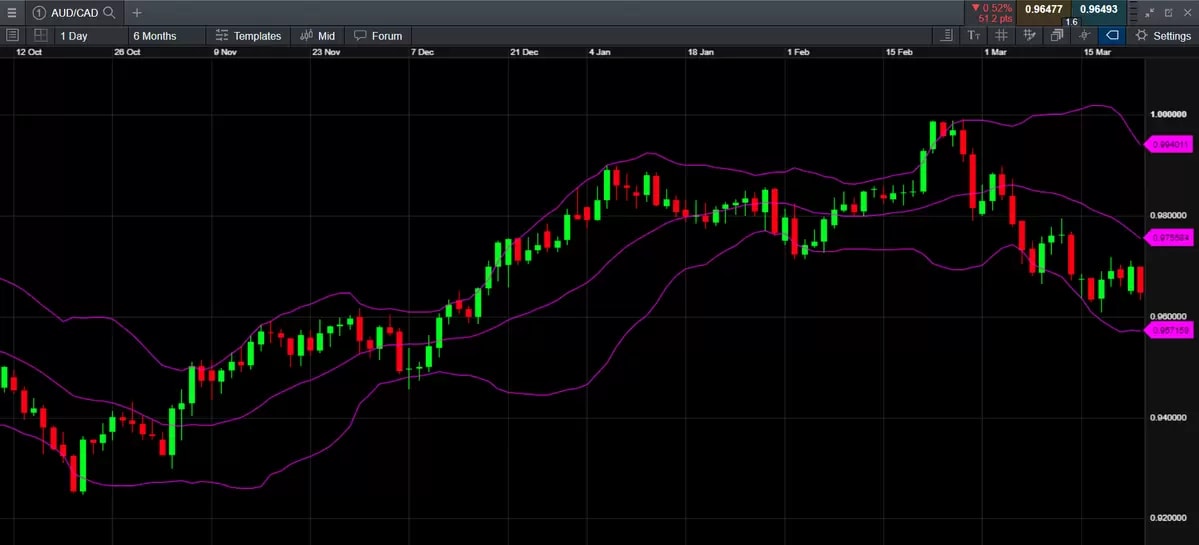
^Bollinger Bands indicator shown on an AUD/CAD candlestick chart
How to use Bollinger Bands
Bollinger Bands can be used on all chart timeframes including weekly, daily, or five-minute charts. The settings can be adjusted to suit different trading styles. When the instrument's price moves towards the upper band, this is a signal that it is overbought. As a general rule, traders look to sell when they believe that an instrument is overbought. When the instrument's price moves towards the lower band, this is a signal that it's oversold. Generally, traders look to buy securities that are oversold.
As a trading indicator, Bollinger Bands are not perfect. They don’t produce reliable signals all the time. Consequently, they are best used alongside other similar technical analysis indicators to provide more accurate trading signals. Some of these complimentary technical analysis tools that can be found on our Next Generation platform include:
Moving averages
Moving averages are a popular trading tool. These are used by traders to determine trend direction. A moving average shows the average price of a security over a certain period of time. The basic rule of moving averages is that if a security's price is above the moving average, the trend is up. If the price is below the moving average, the trend is down.
Moving averages can be set to different timeframes, depending on the trader’s strategy. There are also different types of moving averages. These include a simple moving average (SMA) and exponential moving average (EMA).
Stochastic indicator
A stochastic indicator is another well-known technical analysis tool. These are useful for predicting trend reversals. Stochastics measure the momentum of price movements. Like Bollinger Bands, Stochastic indicators can help traders identify overbought and oversold levels.
Average true range
The average true range (ATR) is a technical indicator that measures volatility. Originally designed for analysing commodities, it can be applied to other instruments such as indices and stocks.
A security experiencing a high level of volatility will have a higher ATR. A security experiencing low volatility will have a low ATR. Traders use ATR to identify entry and exit points. It can be a useful tool when combined with other trading indicators.
Keltner channels
Keltner channels are volatility-based indicators that are similar to Bollinger Bands. The key difference is that Keltner Channels use the average true range to set the band widths, instead of standard deviation. Keltner channels also use an exponential moving average as the middle line.
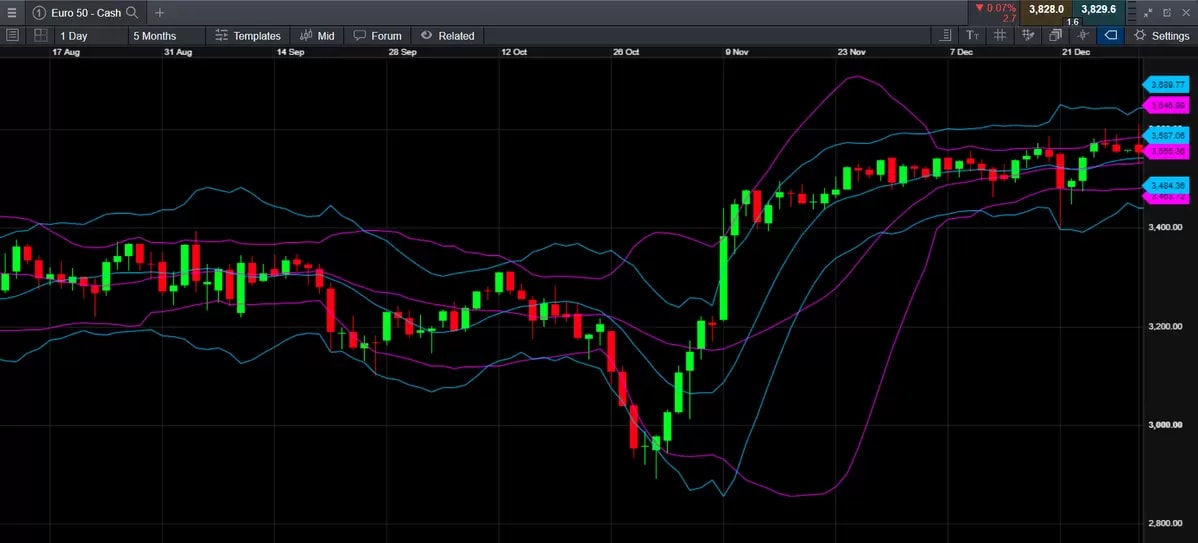
^Bollinger Bands (shown in pink) compared with Keltner channels (shown in blue) on a Euro 50 chart
Bollinger Bands strategy
There are a variety of trading strategies that traders use with Bollinger Bands. Some of the more popular trading strategies that can help traders in bear or bull markets include:
Riding the bands
Many traders mistakenly believe that because a security's price has touched the upper band they should go short, or vice versa. However, such price movements should not be viewed as signals to buy or sell. Price penetration of the bands alone is not an indicator to enter a trade. This is because during a strong uptrend or downtrend, prices can often stick within the bands.
Bollinger Band squeeze
This strategy uses an indicator named 'bandwidth'. Band width is calculated with the following formula:
Band width = (upper Bollinger band value – lower Bollinger band value) / middle Bollinger band value
The idea behind this indicator is that when it hits a six-month low, traders can expect volatility to increase. At this point in time, a squeeze is triggered and the instrument's price may move significantly.
What are the best Bollinger Bands settings?
Bollinger Bands can be set to many different timeframes and adjusted to different trading strategies. For example, the bands can track movements on hourly, daily, weekly and monthly charts. A trader looking at long-term moves in an instrument's price may prefer to set up Bollinger Bands on a monthly chart.
In contrast, a short-term intraday trader may prefer to set up Bollinger Bands on a five-minute chart. In reality, there is no single best timeframe for Bollinger Bands. The timeframe used will depend on the strategy of the trader.
Bollinger Band patterns
Double bottoms
In a double bottom, an instrument's price will move sharply lower, with substantial volume, and close outside the lower Bollinger Band. It will then rebound higher briefly towards the middle band. Lastly, it will fall lower again, this time on lower volume, and close just inside the lower band.
This pattern indicates that downward pressure has subsided. There is a shift from sellers to buyers. Often, the next price movement is a strong move upwards off the second low. Traders may look to go long, targeting the middle or upper band.
Reversals
In a trend reversal strategy, traders look for signs that the price trend of the instrument will reverse. For example, the price may gap up above the upper Bollinger Band, but close near the low for the interval. This can be a signal that the trend will reverse in the near term. The trader may take a short position, targeting the middle band. In the same way, the price may fall below its lower Bollinger Band, but close near the high for the interval. This would indicate that the trader could go long, targeting the middle band.
Bollinger Band trading system
Our Next Generation platform for desktop trading comes with a wide range of technical anaylsis indicators, including Bollinger Bands, Keltner channels, moving averages and more. You can combine indicators on charts and make use of our drawing tools to indicate trendlines, support and resistance levels and potential buy and sell points.
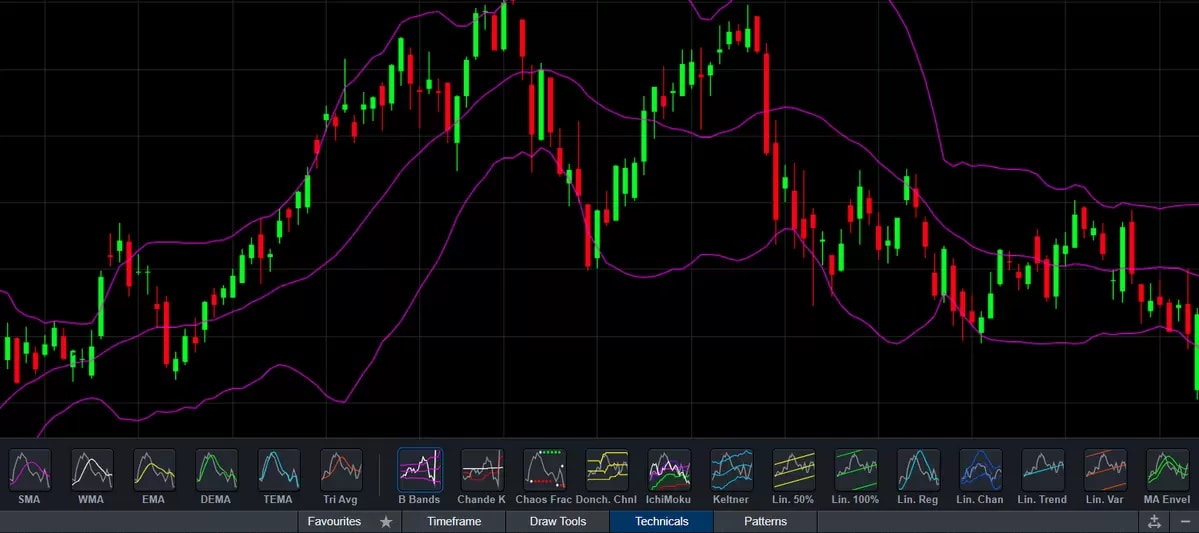
^Range of draw tools and technical indicators, including Bollinger Bands, that are offered on our Next Generation platform
Bollinger Bands app
Our Next Generation platform is also available for trading on the go with mobile or tablet devices. We offer Bollinger Band trading for mobile-optimised charts and technical layouts. Read more about our mobile trading application.
How to interpret Bollinger Bands
Bollinger Bands are an effective technical analysis indicator, however, they do have limitations. Bollinger Bands are based on an instrument's simple moving average, which uses past data points. As a result, the bands will always react to price moves, and not forecast them. In other words, Bollinger Bands are reactive, not predictive, and are often referred to as a lagging indicator, rather than leading.
Bollinger Bands can also be prone to providing false signals. For example, a false breakout occurs when an instrument's price passes through the trade entry point. It signals a trade, but then moves back in the other direction. This results in a losing trade.
When trading with Bollinger Bands, traders should understand that standard settings will not suit all strategies. Long-term position traders may prefer to use a greater number of periods and a higher standard deviation, whereas day traders and swing traders may prefer to use a lower number of periods and lower standard deviation. For this reason, the Bollinger Bands indicator is best used in conjunction with other indicators and tools as part of an overall trading strategy.
Summary
In summary, Bollinger Bands are a useful technical analysis tool. The bands are used to analyse volatility and trend strength, which is particularly useful when opening and closing trades quickly in a volatile market, for example when scalping the forex market. Bollinger Bands can also help predict trend reversals. Traders should remember that Bollinger Bands are based on historical information. Therefore, the bands react to price movements but don’t anticipate future price movements. You should always consider using risk-management controls when trading with Bollinger Bands.
Disclaimer: CMC Markets is an execution-only service provider. The material (whether or not it states any opinions) is for general information purposes only, and does not take into account your personal circumstances or objectives. Nothing in this material is (or should be considered to be) financial, investment or other advice on which reliance should be placed. No opinion given in the material constitutes a recommendation by CMC Markets or the author that any particular investment, security, transaction or investment strategy is suitable for any specific person. The material has not been prepared in accordance with legal requirements designed to promote the independence of investment research. Although we are not specifically prevented from dealing before providing this material, we do not seek to take advantage of the material prior to its dissemination.

