
Candlestick patterns: a guide to candlestick charts
This article explains the basics of how to to read candlestick charts and interpret price action across thousands of financial instruments, such as forex, stocks, indices, commodities, treasuries, and ETFs. See how you can apply candlestick patterns to your trading strategy.
Candlesticks are one of the most popular chart types as they clearly display price action
The body of the candlestick shows the difference between the trading day’s opening and closing prices
A bullish candlestick pattern suggest that asset prices are rising, whereas a bearish pattern suggests that prices are falling
Popular patterns include doji, engulfing, hammer, three black crows and evening star
Many types of technical indicators can be applied to candlestick charts, including moving averages and support and resistance lines
What is candlestick trading?
Today, candlestick charts are used to track trading prices in all financial markets. These markets include forex, commodities, indices, treasuries and the stock market. Stocks represent the largest number of traded financial instruments. The prices at which these instruments are traded are recorded and displayed graphically by candlestick charts. Candlestick charts are one of the most prevalent methods of price representation.
Candlestick chart analysis is an essential skill for traders. Candlestick charts are used to plot prices of financial instruments through technical analysis. The chart analysis can be interpreted by individual candles and their patterns. Bullish candlestick patterns may be used to initiate long trades, whereas bearish candlestick patterns may be used to initiate short trades.
How to read candlestick charts
The body of the candlestick indicates the difference between the opening and closing prices for the day. Candlesticks are generally coloured, as it makes it easier to see whether the candlestick is bullish or bearish. The body of the candlestick is hollow, and the areas above and below the body are called shadows.
A coloured candlestick (usually indicated by black or red) would indicate that the closing price was lower than the opening price, while a candlestick with a transparent body (also usually indicated by white or green) would show that the closing price was higher than the opening price for that day.
The size of a candlestick’s real body along with its wicks or tails can indicate a market’s volatility. Long wicks or tails in conjunction with a small real body signify a volatile market. When a candle has long wicks with a relatively small real body the candles appear “spiky”. The long wicks or tails on these candles can signify a rejection of certain price levels. A candle with a small real body and with long wicks or tails on both sides denotes extreme volatility as well as market indecision. Such candles indicate the lack of market trend.
What are some popular candlestick patterns?
There are over 40 recognised candlestick chart patterns in total. In the below video, Ryan talks through nine candlestick patterns that all traders should be familiar with. He discusses how to analyse candlestick charts, what they mean in the financial market, as well as using the Next Generation web trading platform to illustrate how to use them in practice.
Marubozu
Black marubozus are significant candlestick patterns that give valuable insight into selling pressure. Black marubozus are rectangular candlesticks with little or no shadow at the top or bottom. These indicate selling pressure in a market and show that bears were calling the shots from the opening bell until the closing bell on the day. A marubozu trading strategy is especially valuable for significant support and resistance levels and may indicate that a potential price level is about to be hit.
White marubozus are similar to their black counterparts, but they indicate that prices are being controlled by buying pressure. These are rectangular blocks with very little or virtually no shadows at the top or bottom. White marubozus most commonly indicate continuation in an uptrend, while in a downtrend they can indicate that a potential trend reversal could occur.
Doji
Doji, or crosses, are usually made up of a single candlestick and they show that the opening and closing price of a candlestick is virtually the same. Doji candles resemble crosses or inverted crosses, or plus signs. In technical analysis, dojis usually represent neutrality, meaning that the trend is likely to continue. The shadows or wicks on a doji are an important indicator of market sentiment. For example, if the shadow at the top of the candlestick is long, it means that investors tried to push the price higher, but failed, while a longer shadow at the bottom indicates the presence of selling pressure.
Engulfing pattern (bullish/bearish)
Engulfing candlestick patterns (bullish/bearish market) signify a potential reversal in trend and are indicated by a large candlestick extending higher and lower than (literally engulfing) the previous candlestick. The larger the size of the engulfing candlestick, the more significant it is to analysts. A black engulfing candlestick represents a potential bearish reversal during an uptrend, while a white engulfing candlestick could indicate that a bullish reversal is about to occur in a downtrend.
Hammer
A common bullish reversal pattern, hammers indicate that an uptrend is likely to occur. As the name suggests, hammer candlesticks have a short body, with a shadow or wick that is twice as long at the bottom. When the high and close are the same, it indicates the formation of a bullish candlestick pattern, meaning that while bears tried to push prices lower, buying pressure from the bulls pushed up prices, with prices eventually closing at the same level as the day's high. Hammers candlestick patterns where the open is the same as the high are considered less bullish, but indicate a possible bullish trend nevertheless.
Shooting star
Shooting stars look a lot like inverted hammers from above and indicate that a bearish reversal is about to occur. Shooting star candlesticks are created when the low, open and close of the day are close to each other, with the day's high located high above, forming at least twice the length of the body of the candlestick. When the low and closing prices are the same, a shooting star is considered more significant as it indicates that bulls tried to push prices higher but were overpowered by the bears, and prices eventually closed at a similar level to where they opened. Shooting star candlestick chart patterns can sometimes look like a gravestone doji.
Three-line strike
The three-line strike pattern refers to three white candlesticks occurring on a daily chart timeframe three days in a row, indicating that prices closed higher for three simultaneous days. Three-line strikes usually occur at the end of a downtrend and may, therefore, indicate that a reversal might be in order.
Three black crows
Three-black crows are a common reversal forex indicator in an uptrend and are indicated by three black consecutive candlesticks on a daily chart where the closing prices were lower than the opening price of the day. Formed of three consecutive black candlesticks with long bodies, these indicate the lack of buying conviction in the market, which allowed bears to successfully push prices lower.
Evening star
Evening star candlestick patterns usually occur at the top of an uptrend and signify that a trend reversal is about to occur. Evening stars consist of three candlesticks, with the first candlestick having a significantly large green or white body, indicating that prices closed higher than the opening level. The second candlestick opens higher after a gap, meaning that there is continued buying pressure in the market. The second candlestick in an evening star pattern is usually small, with prices closing lower than the opening level. The third and final evening star candlestick opens lower after a gap and signifies that selling pressure reversed gains from the first day's opening levels.

Trade CFDs on 12,000+ financial instruments
What are bearish and bullish candles?
A candlestick consists of a body and two wicks. The body of a candlestick is drawn as a rectangle, which marks the open and the close of a period. In a bull candle, the open is indicated by the bottom of the rectangle while the close is indicated by the top of the rectangle. In a bear candle, the opposite is true, with the period’s closing price falling below the period’s opening price.
A major benefit is that the candlestick’s body can be colourfully displayed. This allows a trader to quickly get a picture of whether the buyers or sellers are controlling price. The wicks are drawn as two vertical lines above and below the body. The wicks mark the high and the low that price has achieved for the period. The candlestick range is defined by the extreme high of the top wick above the body and the extreme low of the bottom wick.
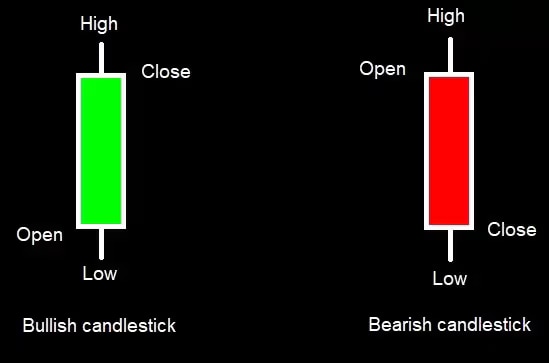
Candlestick trading graphically displays market sentiment. A close above an open indicates bullish market sentiment, and this is denoted by a green candle. Such a candle is called a bull candle. A close below an open indicates bearish market sentiment. This is denoted by a red candle and is called a bear candle. Market sentiment is also denoted by the wicks. A long wick on either side of the candlestick indicates strong rejection of a price level by the market.
Sustained price movement in a particular direction is called a market trend. When prices move higher in a sustained manner, the prevailing market trend is up. When prices move lower in a sustained manner, the prevailing market trend is down. Changes in market trend may present good trading opportunities. It is therefore useful for traders to be able to identify changes in market trends. For example, in the forex market, forex trendlines are used to show uptrends or downtrends through support lines.
Bullish/bearish engulfing candles
Candlestick charts are especially helpful in identifying market trend changes. An engulfing candle pattern is one such indicator of a potential change in market trend. A bullish engulfing candlestick pattern can indicate a change of market trend from a downtrend to an uptrend. Likewise, a bearish engulfing candlestick pattern indicates a change of market trend, from an uptrend to a downtrend. A bullish engulfing candlestick pattern forms when a large bull candle completely envelopes the previous and relatively smaller bear candle. This pattern can signify a change in market sentiment, from bearish to bullish. It is therefore seen as an indicator of market trend change.
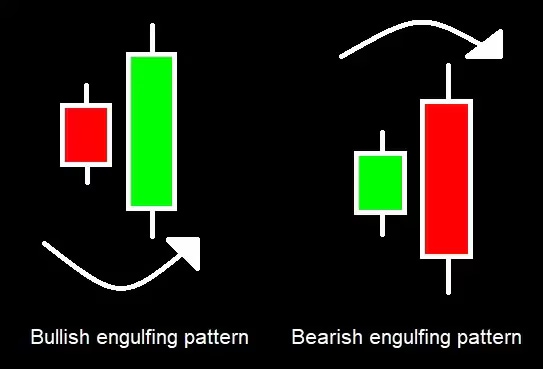
An important consideration is the location of where these engulfing patterns are situated in the context of an overall price trend. In the illustration above, it becomes evident that when these patterns are situated at the extremes of a price trend, they tend to have a bearing on where price is likely to head next.
Why are these types of charts important?
Traders make important decisions on whether to buy or sell financial products by analysing market conditions and the instruments themselves. This analysis can be based on non-price information. Such analysis using non-price information is known as fundamental analysis. On the other hand, a buying or selling decision based on past and present prices of a financial instrument is known as technical analysis.
For technical analysis to be carried out, prices need to be represented graphically on a chart. Candlestick charts present the technical analyst with a visual snapshot of the market. Eventually, with time and experience, you can quickly analyse market conditions and make a trading decision through technical analysis.
Candlestick patterns confirm potential market occurrences in conjunction with individual candles, and these come in the form of either continuation patterns or reversal patters. Examples of continuation patterns are three white soldiers or three black crows. These are patterns with three bull candles or three bear candles in a row. They indicate that a trend is likely to continue in a particular direction. Three white soldiers signify the continuation of an uptrend. Three black crows signify the continuation of a downtrend.
It is important for traders to be direction agnostic, as a trader has the potential to make a profit (or loss) irrespective of whether the market is rising or falling. Entering a position when the market is falling is known as going short. A trader would usually only initiate a short position when a market trend has reversed from an uptrend to a downtrend. Traders most commonly use shorting positions to short stocks within the share market.
How to draw candlestick charts
Candlestick charts can be displayed and customised through our online trading platform, Next Generation. We have several significant charting features, such as drawing tools and price projection tools, ensuring that your trades are set up as clearly as possible. It is a simple and easy process to set up a demo account with us to start candlestick trading using virtual funds.
Remember that when trading the financial markets, you are constantly exposed to market risk. While trading following patterns and studies, traders should always be aware of the potential risk of algorithmic trading. This uses information at the speed of light and can alter the landscape at any time using data that might not be available to the trader.
Therefore, it is important that you consider risk-management prior to entering any trades. Similar to other systems of trading, you will need to have an idea of where to stop out and where to take profits before you enter a trade. We also recommend that forex traders take stop-loss orders into consideration, as trading with leverage can maximise profits, but can equally maximises losses.
Forex candlestick patterns: an example
Forex candlesticks are especially useful in offering insight into the short-term price movements of the markets, making them a valuable tool for forex day trading strategies. In a typical Japanese candlestick chart, each candlestick represents the open, high, low and close prices of a given time period for a currency pair.
For instance, in a daily candlestick chart for EUR/USD, the wick or shadow at the top of the candlestick would show the highest level prices reached on that day, while the wick or shadow at the bottom of the candlestick would show the lowest level prices reached on that particular day.
The formation of a candlestick requires the open, high, low and close prices of a specific period. For example, a trader would need the daily, open, high, low and close price to generate a daily candlestick. This would be the same for either a weekly or monthly candlestick. For the candlestick to be successfully evaluated, you would need to wait for the closing price of a session.
Doji candles are some of the easiest patterns to recognise on a trading chart, making them more reliable than others, although these can still be interpreted in different ways. Examples include the dragonfly, gravestone, long-legged, star, and hammer patterns.
Candlestick charts can be good for novice traders, as they clearly display entry and exit points. Other chart types, including line, bar, and Renko charts, can lack granular information, making it more difficult to determine these points.
As with all types of trading, they’re not guaranteed to make you profits, as the markets can be volatile and trading with leverage can result in equal amounts of losses. However, candlestick charts can help you to determine trends, whether these are bullish or bearish, which may lead to profits if your trade is successful.

