Moving average convergence divergence (MACD)
The moving average convergence divergence (MACD) is a simple yet effective trading indicator that is used to identify new trends and decipher if they’re bullish or bearish. The MACD indicator is a trend-following momentum indicator/oscillator, developed by Gerald Appel in the late-1970s. It is used to determine the strength and momentum of a trend and is calculated on price data, which is plotted as a time series.
The MACD can provide a visual snapshot to help analyse trends, allowing traders to scan charts rapidly. That makes it an invaluable tool for technical analysis, especially with the myriad of financial instruments available to traders today, in particular the forex market, as well as indices, commodities and shares. Learn how to interpret and use the MACD for technical trading on our Next Generation platform.
MACD indicator
The idea behind the MACD is simple:
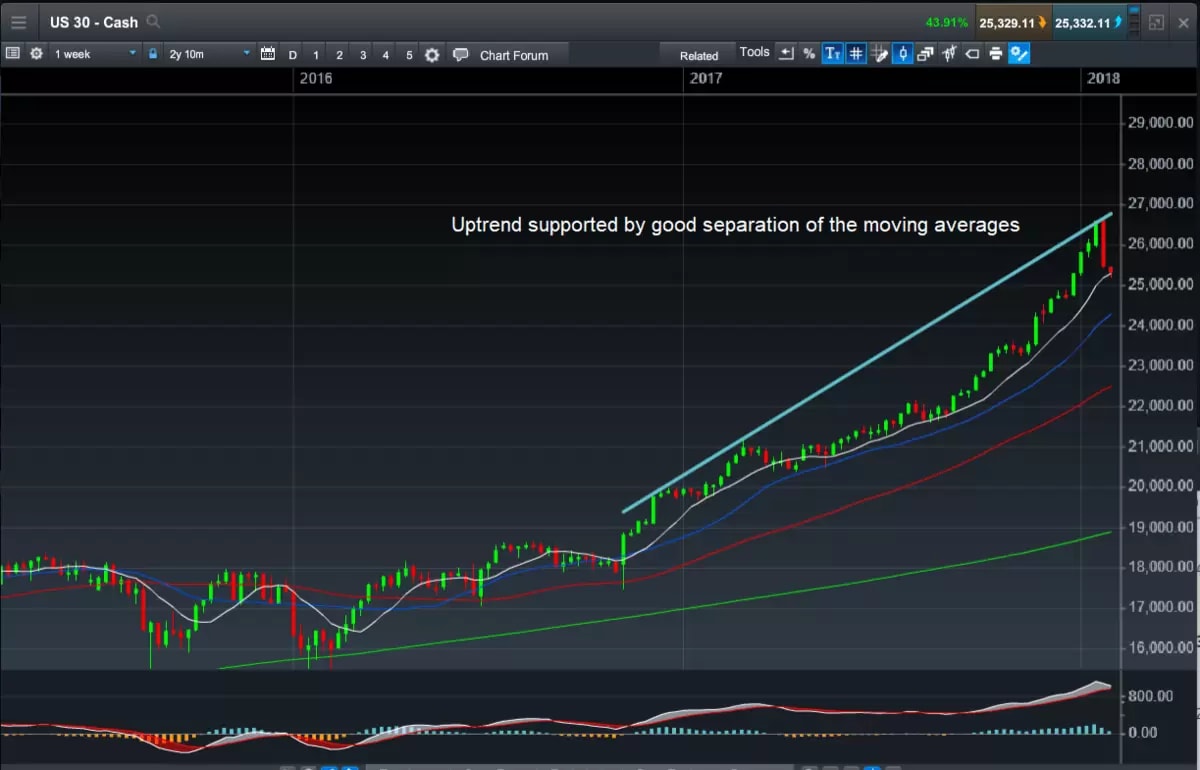
The degree/magnitude of separation between a shorter and longer-term moving average (MA) denotes the strength of a trend. It also indicates the momentum of that trend.
The underlying logic is that a shorter-term MA reflects current price action; whereas a longer-term MA reflects earlier price action, in addition to the current price action.
If there is a good separation between these two MAs, it means that the current price action is moving away from earlier price action. This indicates that the market is trending either up or down.
A time series is simply a set of data plotted over time. An example of a time series would be temperature data. The classification of price points as either high, low or average, and are plotted daily. Financial instruments traded in the market are plotted as price data that is continuously recorded. Prices may be plotted for a certain number of transactions (ticks). They may also be plotted in time periods, of usually one second and upwards. They are plotted on a chart as the open-high-low-close for that period; either as an open-high-low-close (OHLC bar), or as a candlestick chart.
The astute trader can gather a wide breadth of information by studying the MACD, using it to establish a market’s prevailing trendlines and momentum.
Calculating MACD
The mathematics behind MACD is relatively simple and powerful when used effectively. The MACD is calculated by subtracting the slow EMA from the fast EMA. In the example below, the fast EMA (12) has a value of 6,151.99 and the slow EMA (26) has a value of 5554.52. The resultant MACD value is 597.16.
MACD vs moving averages
A moving average is an average of time series data calculated over a certain number of time periods. As we progress through time, the latest period factors into the calculation, and the earliest period from the previous calculation drops off.
A faster MA is defined as one that is calculated over a smaller number of periods. A slower MA is one calculated over a larger number of periods. Calculated MAs are subsequently plotted on the charts and are usually overlaid on top of the price action.
MAs come in multiple variations, but some may be more relevant than others in understanding the MACD. There are three moving averages:
A simple moving average (SMA) is an average of data plotted over a certain number of periods.
A weighted moving average (WMA) is a moving average with greater emphasis (or weight) being placed on certain (or few) periods.
The exponential moving average (EMA) is where more recent periods have a higher weight in the calculation, compared to earlier periods. This is done using a weighting multiplier calculated as 2/(time period + 1). Therefore, for a nine-period time series, it is 2/(9 + 1) which is 0.2 or 20%.
Given that the logic behind the MACD is to compare recent versus earlier price action, an EMA is more applicable and used in the MACD calculation as a result.
How to trade with MACD indicator
The prices of all these financial instruments aren’t moving in a straight line, but rather in a jagged ‘up and down’ fashion with a series of sharp peaks and troughs. These fluctuations and oscillations are filtered out by low-pass filters. A low-pass filter will pass signal with a frequency that is lower than a selected cutoff frequency and attenuate signals with frequencies higher than this cutoff frequency. MAs present a smoother profile, which allows for ease of analysis and identifying trends.
The MACD formula seeks to harness the benefits of two low-pass filters: a fast EMA and a slow EMA. The standard or "box" setting for the fast EMA is 12 periods, for example, an EMA calculated over 12 periods. The standard or "box" setting for the slow EMA is 26 periods, for example, an EMA calculated over 26 periods.
Open an account now to get started trading with our wide range of technical analysis tools and indicators.
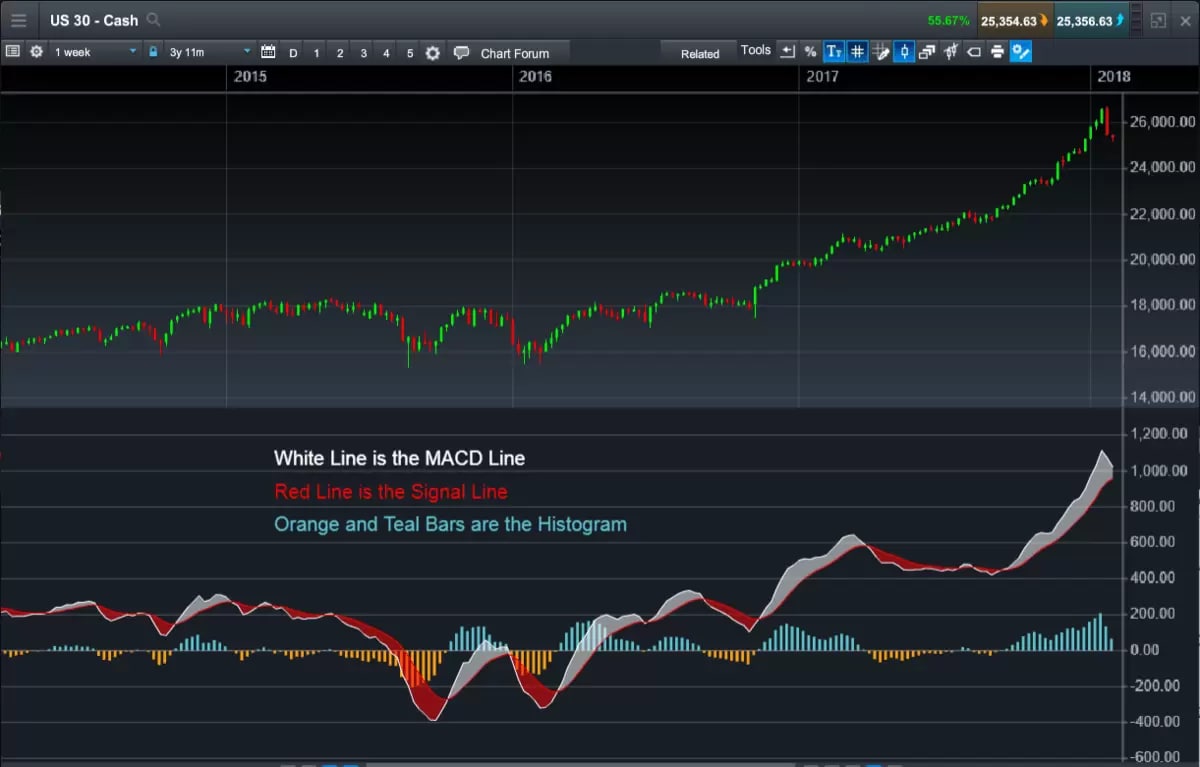
How to read MACD histogram
The MACD indicator consists of signal lines and a histogram. The histogram displays the difference between the MACD line (more commonly referred to simply as MACD) and the signal line plotted as a bar chart over time. The MACD histograms oscillate above and below a "zero line", where the MACD and the signal line intersect. The shape of the histogram is important, for example, a rising histogram profile indicates an uptrend. The shape of the histogram with respect to the zero line also has a bearing on the trend, as a strong downtrend is indicated by a falling profile below the zero line.
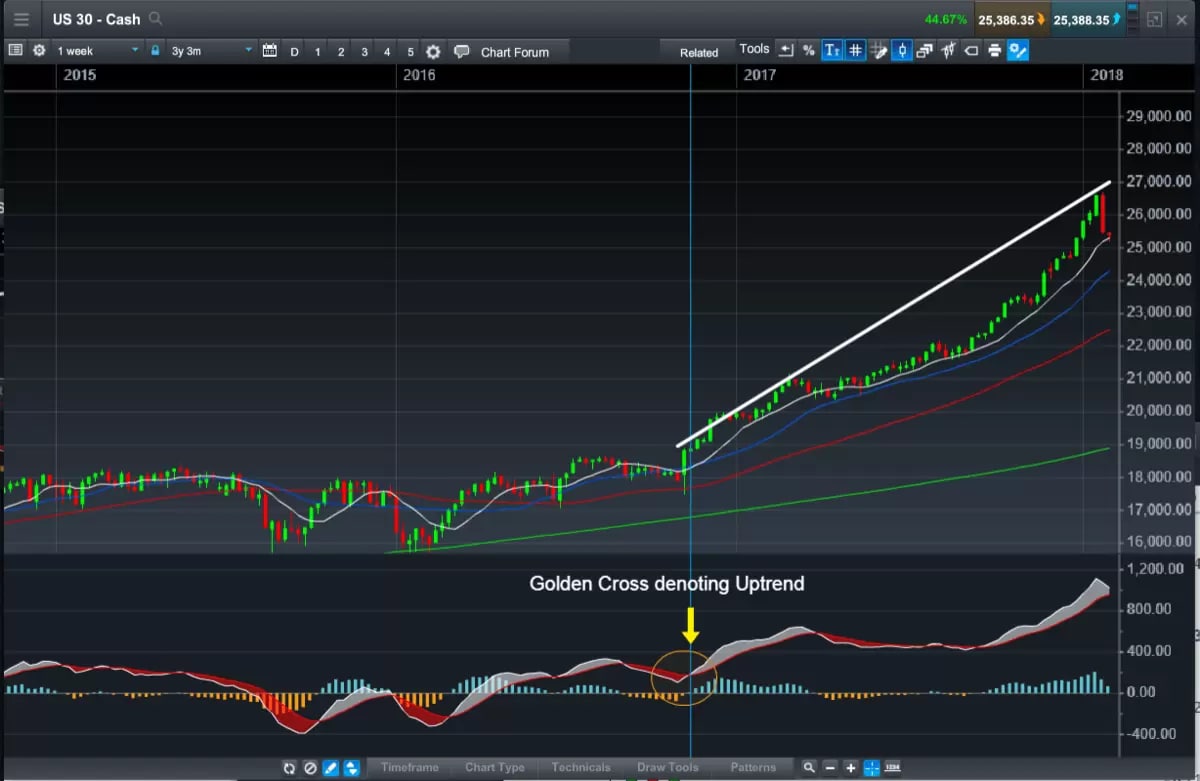
Daily MACD crossover
The MACD can be used in several ways by traders. At a very basic level, it is used to generate buy and/or sell signals using crossovers. When the MACD crosses the signal line from under it and goes over, a buy signal is generated. Such a crossover is often known as the "golden cross". Conversely, when the MACD crosses the signal line from above and goes under it, this generates a sell signal, and is often known as the "death cross". These are also referred to as an MACD bearish crossover or a MACD bullish crossover, depending on which way the price heads.
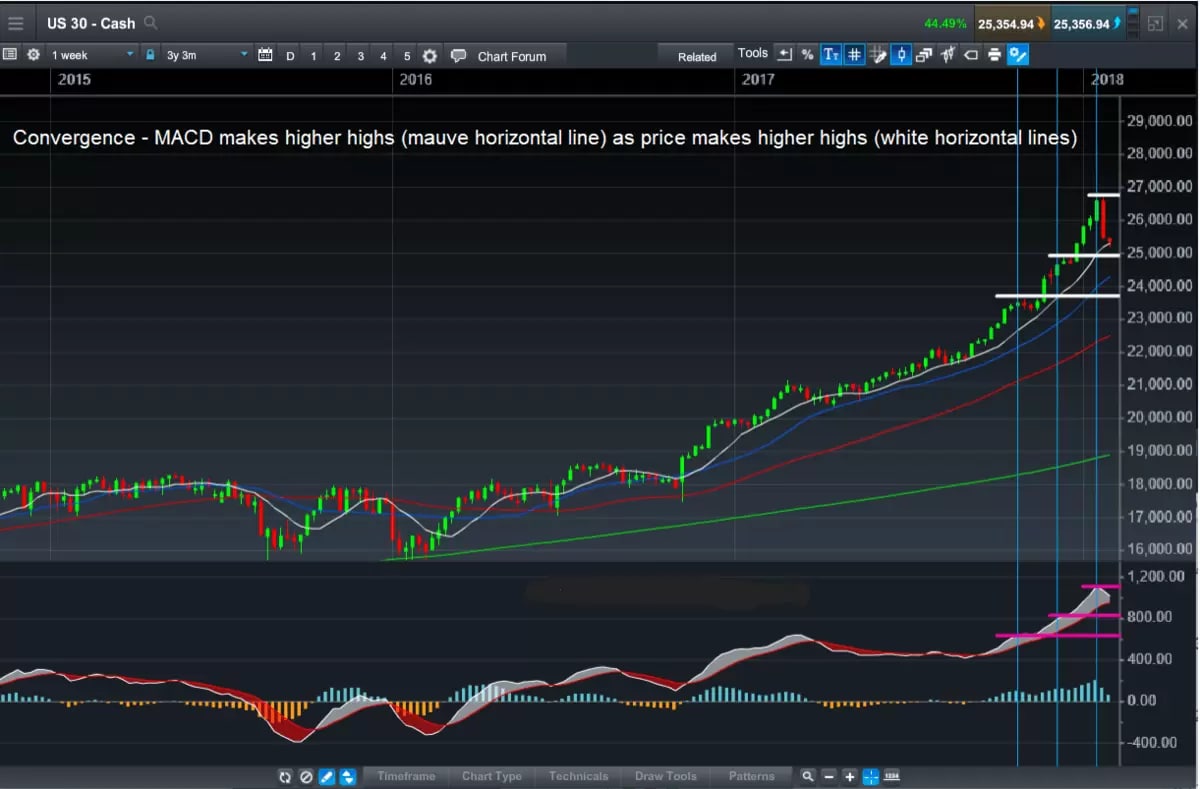
MACD divergence
The MACD indicator, despite being one of the first indicators to be developed, is still widely used in today’s modern markets due to its effectiveness. One of the core reasons it has remained at the forefront of technical analysis portfolios is its ability to predict potential market direction in conjunction with price action.
The way to do this is by using the concepts of divergence and convergence. The MACD is said to be convergent with price action if both prices and the MACD are moving in the same direction. In other words, if prices are making higher highs (in an uptrend) and the MACD makes corresponding higher highs, then we have convergence. Convergence of the MACD with price action confirms the strength, direction, and momentum of a trend. If the MACD moves in the opposite direction, making lower highs as price is making higher highs, then we have negative divergence. Divergence with price action indicates the potential weakening or possible reversal of a trend.
MACD signal lines
The MACD signal line is the second component of the MACD indicator. It is an EMA of the MACD over a certain number of periods. The standard or "box" setting for this is nine, in other words, an EMA of the MACD calculated over nine periods. It is used to generate buy and sell signals as the MACD line crosses.
As the MACD and MACD signal line are derived from two EMAs, their value will be dependent on the underlying security. As such, it is not possible to compare these values for a group of currencies or across markets such as between the US SPX 500 and an exchange-traded fund.
MACD setup
The MACD indicator is available on our online trading platform, Next Generation. Our award-winning platform allows traders to customise technical indicators and tools, add drawing tools to price charts and graphs, and identify chart patterns in order to improve your trading strategy. Read more about our charting features here. In addition, the platform is also available via mobile trading apps, for both Android and iOS systems, so you can practise your MACD trading strategy on-the-go.
Benefits of MACD
The MACD is a relatively simple indicator, easy to comprehend, appeals to intuitive logic and therefore resonates well with most traders. It can be a powerful tool if used effectively, especially for assessing the strength and momentum of trends, and consequently to predict their continuance and potential reversal.
Limitations of MACD
One of the most significant limitations of the MACD is the occurrence of false positives. A reversal is signalled, but never takes place. The opposite can also take place, where a reversal occurs without being signalled. A way to attempt to overcome any of these false signals would be to implement a MACD signal line filter.
Another drawback is that moving averages slightly lag behind real-time prices. This is because it’s an average of the historical prices, so any drastic changes in price would not be seen straight away. Therefore, although the MACD is widely used by traders, it might not be the best technical tool to use in isolation when dealing with volatile price movements. Instead, be sure to use in combination with other technical indicators, such as the average directional index (ADX).
Disclaimer: CMC Markets is an execution-only service provider. The material (whether or not it states any opinions) is for general information purposes only, and does not take into account your personal circumstances or objectives. Nothing in this material is (or should be considered to be) financial, investment or other advice on which reliance should be placed. No opinion given in the material constitutes a recommendation by CMC Markets or the author that any particular investment, security, transaction or investment strategy is suitable for any specific person. The material has not been prepared in accordance with legal requirements designed to promote the independence of investment research. Although we are not specifically prevented from dealing before providing this material, we do not seek to take advantage of the material prior to its dissemination.
*The Financial Services Compensation Scheme is an independent body that offers protection to customers of financial services firms that have failed. The compensation amount may be up to £85,000 per eligible person, per firm. Eligibility conditions apply. Please contact the FSCS for more information.

