
Momentum trading strategies
Momentum trading is a technique where traders buy and sell financial assets after being influenced by recent price trends. They look to take advantage of upward or downward trends within the financial markets until the trend starts to fade.
Momentum trading strategies focus on price action and price movements rather than fundamental factors, such as company growth or economics. This is a form of technical analysis that is very popular with short-term traders. However, traders calculate momentum price projections based on historical price trends and data, and given the volatility of financial markets, prices can change and the market can move in an unforeseen direction at any time. The markets are also affected by news releases and other macroeconomic events, which need to be taken into account when building a momentum trading strategy and risk management plan.
How to use this guide
To get the most out of this guide, it’s recommended to practice putting these momentum trading strategies into action so that you can learn which ones work most successfully for your trading style. The best risk-free way to do this is with a demo account, which gives you access to our institutional-grade trading platform and £10,000 in virtual funds for you to practice momentum trading with. Get your free demo account.
Once you’ve found a strategy that has been profitable for you, you may wish to upgrade to a fully-funded live account where you can profit from your newfound trading edge.
What is momentum based trading?
Momentum trading aims to take advantage of a markets current trend as it gains in velocity, either increasing or decreasing in price. Momentum trading can be used across all markets; however, it is most often used by Forex & stock traders due to the volatility and liquidity of those markets.
Liquid markets are also particularly volatile and this means that momentum traders can take advantage of short trades through price swings, which is similar to other short-term trading strategies, such as day trading.
Trend following vs momentum
Trend following is another trading strategy that is used to identify trendlines within price charts when trading assets. Trend following and momentum strategies share similarities in that they both focus on price action, buy high on uptrends and sell low on downtrends. However, whereas momentum based trading relies on aspects of fundamental analysis to make predictions, trend followers tend to focus solely on price and the size of their trades. This is partially to reduce time and make quicker trades, but also to help reduce losses. Trend followers measure their position size with the trend rather than placing a large amount of capital in one position.
Momentum trading vs swing trading
Whereas momentum strategies focus on following the current trends of an asset, swing trading takes a different approach to this. Instead, swing traders trade within ranges and tend to focus on buying and selling at support and resistance levels. As they trade on short-term price changes, most swing trades usually only last for a short duration, while momentum trades can last either in the short-term or long term, depending on the strength of a trend. Swing traders also do not take into account fundamental and economic factors that may have an effect on price trends.
Momentum intraday trading
Momentum in trading is often influenced by timeframe. Although some momentum traders prefer to take positions in the long-term, one of the most appropriate strategies for trading on momentum is the short-term approach of day trading. The aim of day trading in the UK is to enter and exit multiple positions as quickly as possible throughout the day, with the aim of making a profit from small price movements. Therefore, momentum traders look for markets and securities with a high volume, so that they can buy and sell stocks quickly without interruption.
If each security has a range of at least $5, this is considered profitable enough for momentum intraday trading. Smaller price movements are more suited to scalping strategies, which are very common within the forex market, where currencies fluctuate by a number of ‘pips’. Learn how to scalp forex here.
How does momentum work in stock trading?
As we have already discussed, momentum strategies are arguably the most useful for volatile markets, where there is a constant stream of traders. With this in mind, momentum in share trading is one of the most monitored markets. Share trading is a financial market where stocks are constantly changing in price, due to external factors. These include aspects of fundamental analysis, such as company earnings reports, updated P/E ratios and takeover bids. Company analysis is an important process of stock screening when a trader is interested in momentum in share trading.
The share market also applies to exchange-traded funds (ETFs), which are investment funds that grant a trader access to a collection of underlying assets. Various ETFs seek to track the performance of momentum-based indices within the stock market, most often large cap or blue-chip stocks, where is a constant stream of price action. Developing an ETF momentum trading strategy follows the same protocol as the share market, although you will be trading on multiple securities at once, rather than a single share.
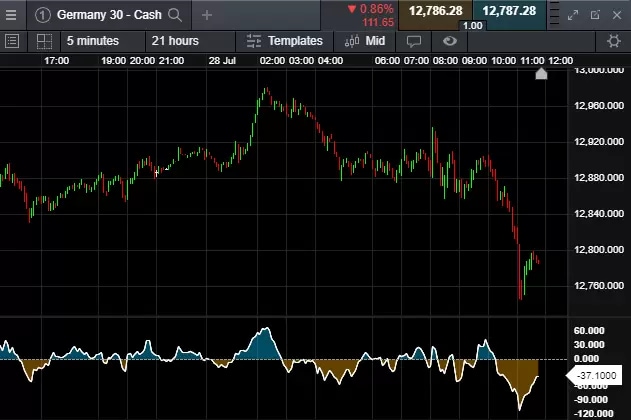
Momentum indicators
Below are some of the most popular and efficient technical indicators for a momentum trader to succeed in their strategy. Some of the most effective momentum indicators tend to focus on price action rather than a stock’s long-term economic situation.
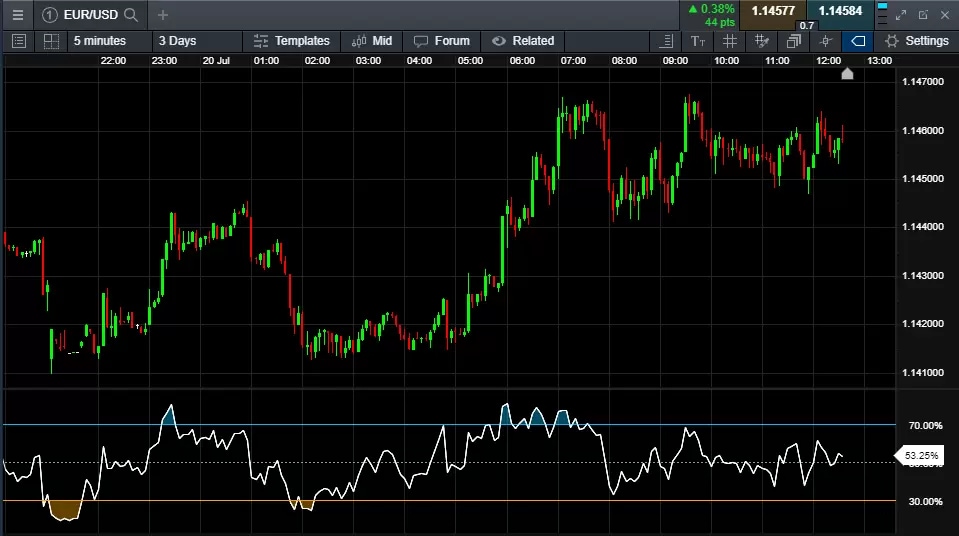
Relative strength index (RSI)
The relative strength index (RSI) is a type of oscillator that is used to predict the future direction of a market. It shows whether momentum is accelerating or decelerating by generating a measurement of how overbought or oversold a security is, on a scale from zero to 100. In general, a reading above 70 means that the asset is overbought, and a reading below 30 means that it is oversold.
The RSI works by looking for divergence and price swings. Divergence occurs when momentum is moving in one direction, but prices are moving in another. Most commonly, a bearish divergence forms when there is a weakness in the trend, meaning that prices are rising to a new high but the indicator can only show a lower high than previously. This signals a possible downtrend and momentum traders prefer to open and close positions within the trend.
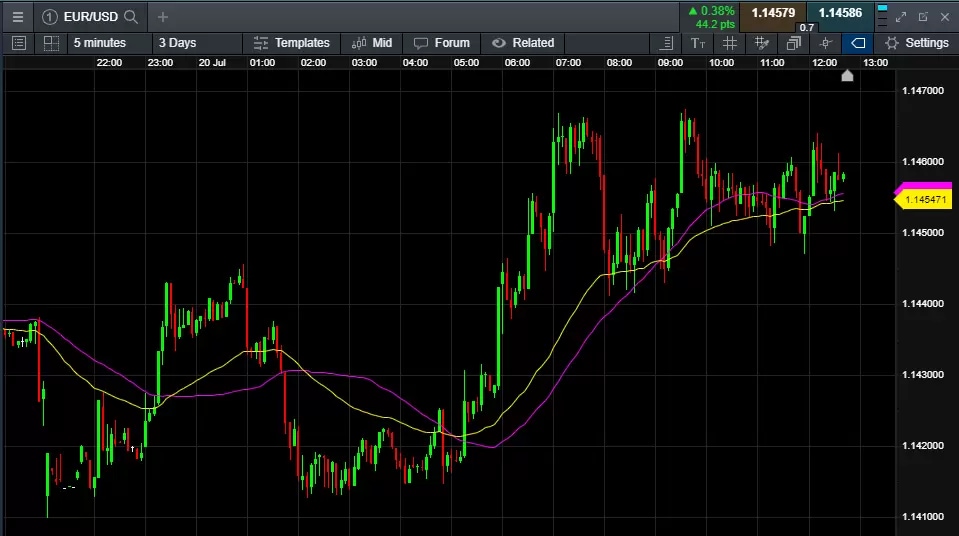
Moving averages (SMA and EMA)
The simple moving average (SMA) is one of the most popular technical indicators to use across all financial markets. It aims to identify trends within price charts by smoothing out past price action, and can be used for both short-term and long-term trading strategies. The SMA shows the average price of a security over a certain period of time and can be customised on our platform, according to different time horizons.
Moving averages are not an official momentum-based indicator, but rather a lagging indicator that helps to identify entry points for a momentum trader. Therefore, it is a good idea to use moving averages as part of your momentum trading strategy along with other technical indicators, such as those on this list.
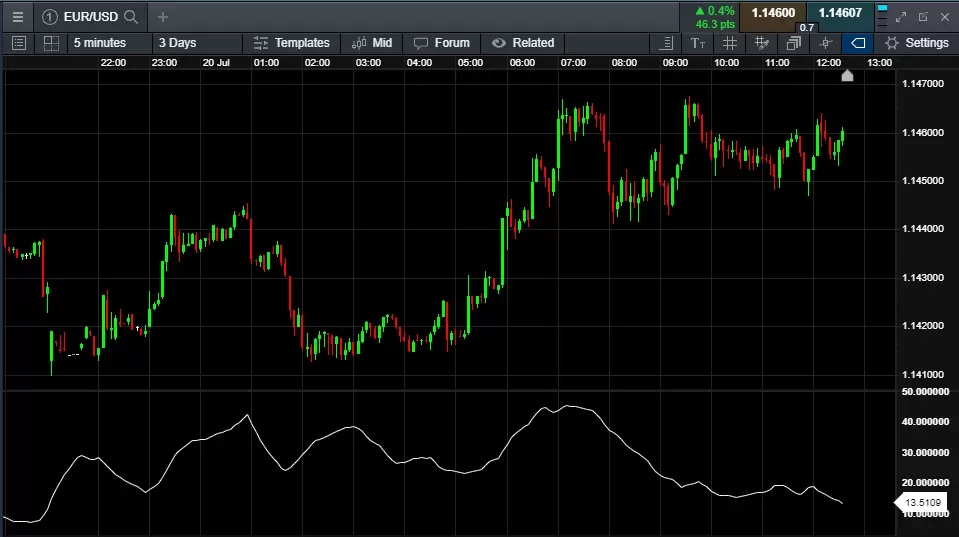
Average directional index (ADX)
The ADX indicator is used to measure when a trend is gaining or losing momentum. It is calculated based on a moving average of price action over a period of time, and shown as a single line on the graph. An ADX value of 25 or over is an indication of a strong trend, whereas a value of below 25 is seen as a weak trend and momentum traders will usually avoid using strategies within this range. Higher peaks on a chart show that a trend momentum is rising, whereas smaller peaks means that momentum is entering a downtrend and this usually signifies when a trader should exit their position.
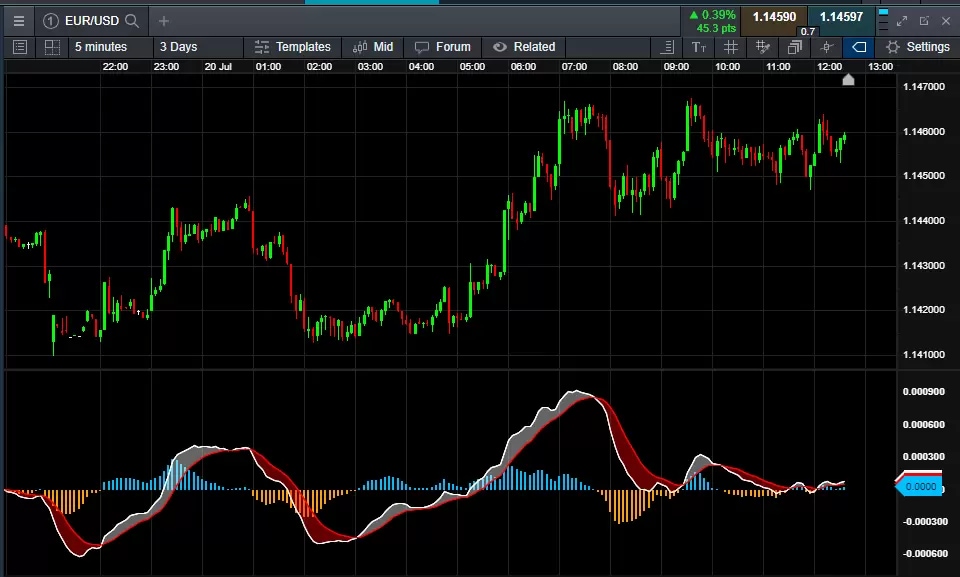
Moving average convergence divergence (MACD)
The MACD indicator helps to decipher whether new trends are either bullish or bearish. The trend oscillator is calculated from price data and plotted as a time series on a graph. Similar to the other technical indicators on this list, it uses a moving average. The theory behind the MACD is that a short-term MA reflects current price action, whereas a long-term MA reflects current and past price action.
If there is a good degree of separation between the two lines, this denotes a new trend. Convergence of the MACD with price action confirms the strength and positive direction of an upward trend, whereas divergence with price action confirms the weakening and reversal of a downward trend. For this reason, momentum traders use this technical indicator in particular for future predictions.
The momentum indicator
This indicator is classified as an oscillator, since the line fluctuates between values of a centreline. It aims to compare prices from the most recent closing point with other closing prices within a particular timeframe. The momentum indicator measures the strength of an uptrend or downtrend based on price movements, and can determine how overbought or oversold an asset is. It can also be classified as a leading indicator, rather than a lagging, as it helps to generate buy and sell signals before a trader opens a position. Read more about leading and lagging indicators.
Learn to trade on momentum
Research the financial market and asset that you would like to trade.
Think about whether you want to open long-term or short-term positions, and then find a compatible strategy, such as position trading or day trading.
Devise an entry and exit strategy.
Create a demo account to practise your momentum trading strategy with £10,000 worth of virtual funds.
Familiarise yourself with our range of technical momentum indicators, which are not limited to the list above. We also have awesome oscillator and stochastic momentum index (SMI) indicators.
Identify periods of volatility. Risk management tools such as stop-loss orders can help to reduce losses if the market moves in an unfavourable direction.
When you are ready, open a live account and start trading the live markets.
Momentum trading system
Our award-winning spread betting and CFD trading platform, Next Generation, comes complete with advanced charts and graphs for displaying your positions, so that momentum is clearly defined. In addition, the platform is easy to customise and our drawing tools allow traders to draw their own trendlines. Discover our charting features, which include price projection tools and a list of twelve different chart types that are available.
What are momentum trading patterns?
Momentum trading patterns are important tools for technical analysis. Chart patterns help to highlight market trends and predicting future price movements of an asset, and can help a trader to decipher whether a current trend is possibly due to weaken. You can use chart patterns for all markets, but in particular, stocks and forex. Take a look at our guide to chart patterns here.


Ready to get started?
Disclaimer: CMC Markets is an execution-only service provider. The material (whether or not it states any opinions) is for general information purposes only, and does not take into account your personal circumstances or objectives. Nothing in this material is (or should be considered to be) financial, investment or other advice on which reliance should be placed. No opinion given in the material constitutes a recommendation by CMC Markets or the author that any particular investment, security, transaction or investment strategy is suitable for any specific person. The material has not been prepared in accordance with legal requirements designed to promote the independence of investment research. Although we are not specifically prevented from dealing before providing this material, we do not seek to take advantage of the material prior to its dissemination.