Leading and lagging indicators
Leading and lagging indicators are types of technical indicators that either give traders an indication of what could happen next within the financial markets, or provide information on what has already happened. Leading and lagging refers to whether the indicator moves before or after another metric, such as price action.
Both leading and lagging indicators are useful and may provide traders with the information they need to make trading decisions. In this article, we look in detail at leading and lagging indicators as part of a technical analysis strategy, and show how to incorporate these tools into your trading. Some traders like using technical indicators because they can be easy to measure, although interpreting them correctly requires some skill.
What is a leading indicator?
A leading indicator aims to provides information before another metric. Indicators that point to where the price could move next are seen as leading indicators, as in most cases, price action is what the indicator is compared to. If the price is dropping and an indicator starts rising before the price does, that may be considered a leading indicator, because the indicator is forewarning of a price rise.
For example, Fibonacci retracements and extension tools are considered leading indicators because they attempt to forecast where the price may go next before it happens. Remember that leading indicators aren’t always correct; sometimes the price will move in the direction the indicator points, and sometimes it won’t. It should only be used as guidance for your trading strategy and not relied on exclusively.
What is a lagging indicator?
Most technical indicators are lagging indicators, as they only look at historical data and aren’t suggesting which way the price will go next. However, lagging indicators can lead price in some contexts, such as divergence.
Divergence occurs when the price makes a new high above a prior swing high but the indicator does not, or the price makes a new low below a prior swing low but the indicator does not. This is a leading indication that the price action may be slowing down and the trend is close to reversing. Read more about trading trend reversals.
The following chart shows several divergence examples using the Relative Strength Index (RSI) on a trading chart for our Big Tech share basket, which is an exclusive product offered at CMC Markets.
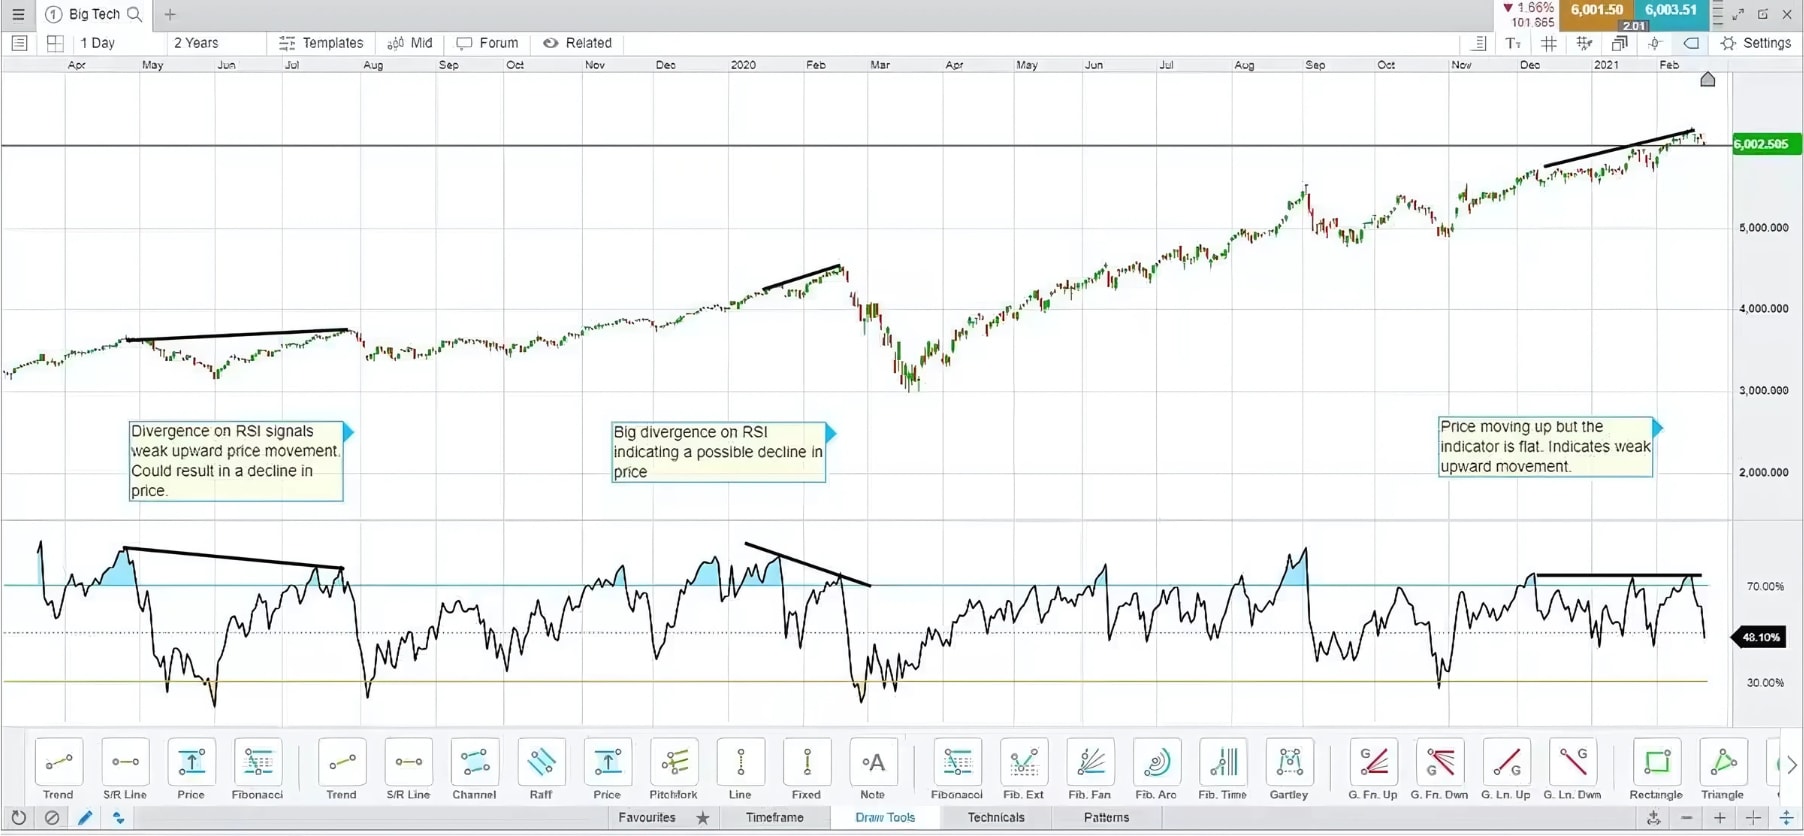
RSI indicator showing divergence on a Big Tech chart
A lagging indicator tends to move behind the price and it provides delayed feedback to the trader. A moving average is an example of a lagging indicator. If the price is dropping and then comes back up, the moving average may continue going higher after the price does.
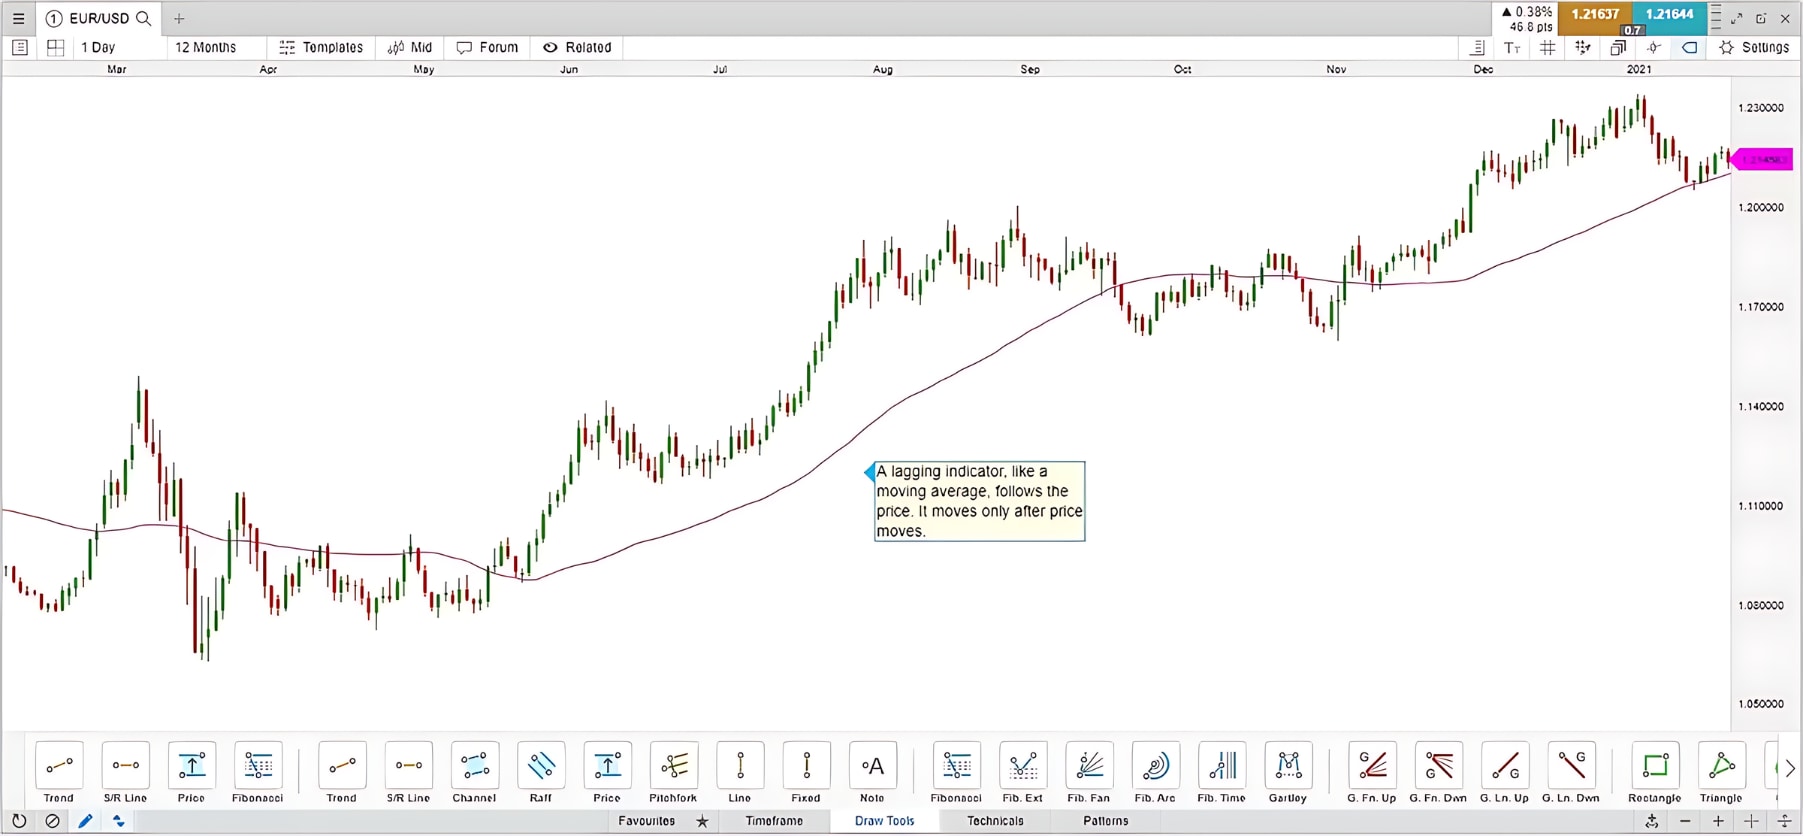
Lagging moving average indicator on a EUR/USD chart
Lagging indicators are still useful because they can simplify the price action and show traders where the price has been. This may improve or influence their insight into where the price may go next. Therefore, we cannot say which type of indicator is better: leading or lagging. They are both trading tools that can be used to help make decisions.
Open a demo account to practise applying leading and lagging indicators to your price charts.
Examples of leading and lagging indicators
Leading indicator: Relative Strength Index (RSI)
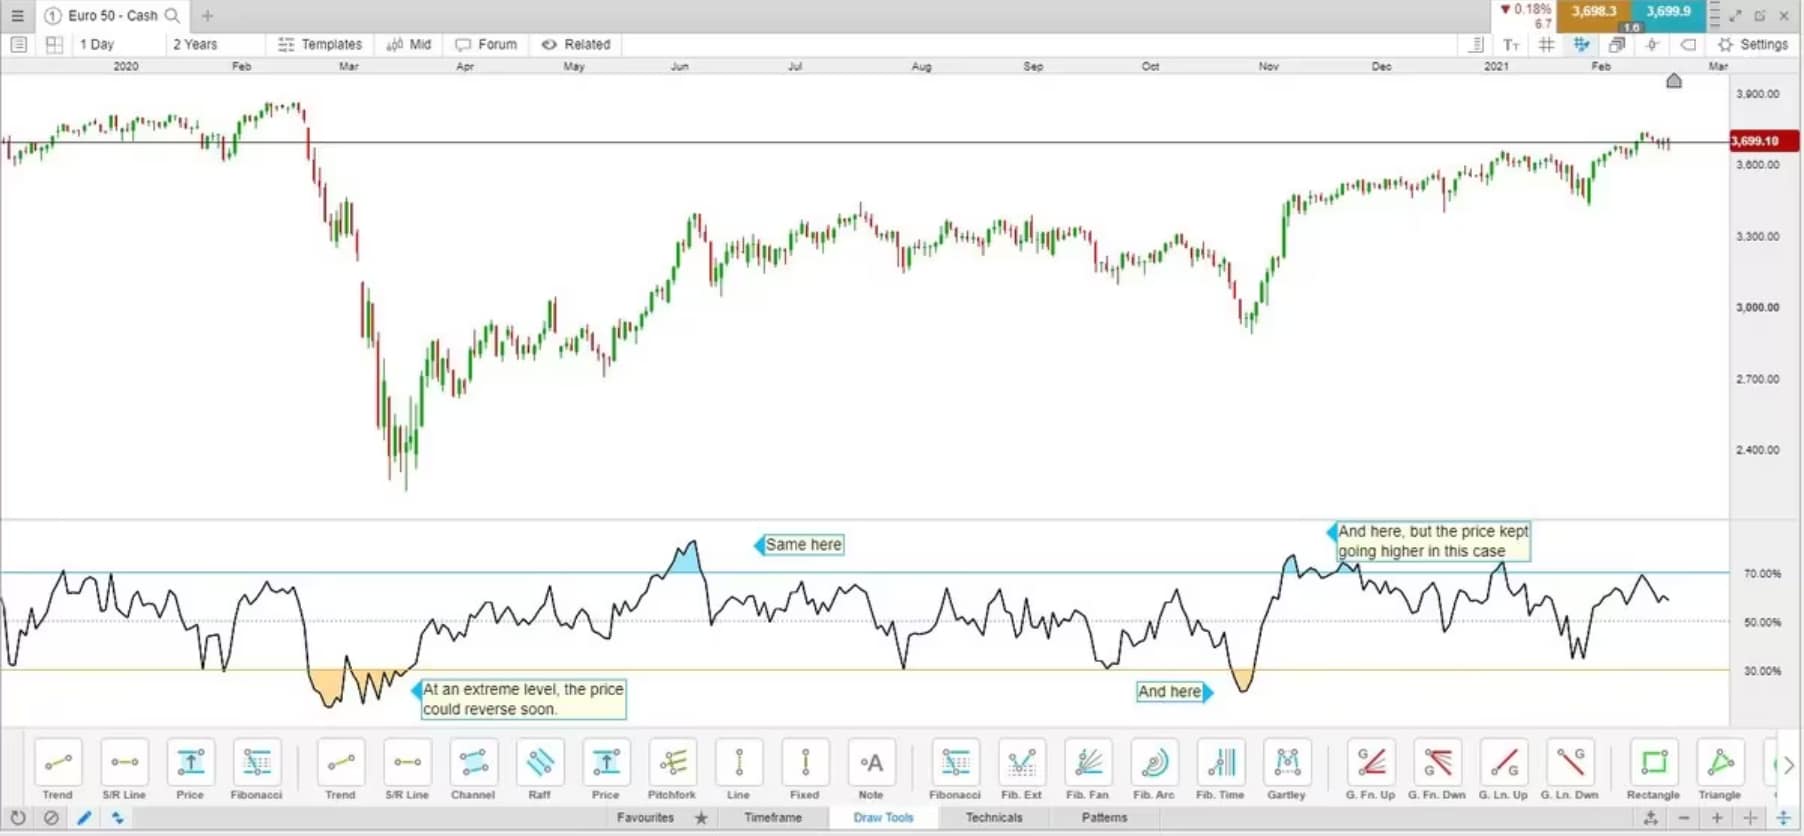
The relative strength index (RSI) is a technical indicator that can act as both a leading and lagging indicator. In its absolute sense, it is a lagging indicator, because the price has to move first for the indicator to start moving in that direction. It basically moves with the price, with a slight delay.
That said, it can be a leading indicator. When the RSI reaches extreme levels, it can signal that the price is overextended and may soon reverse in the other direction. But because the indicator lags price, traders could consider waiting for the price to actually start reversing before acting on the signal. As discussed above, divergence can also transform the RSI into a leading indicator, providing insight on when trends may be running out of steam and are ready to reverse.
Lagging indicator: simple moving average (SMA)
Moving averages are considered lagging indicators because the average simply follows the price, with a delay. For example, if the price is dropping and then comes back higher, the moving average could start moving higher after the price does.
Moving averages can also be leading indicators as they may signify where the price may find support or resistance in the future. The price will often move back to the moving average because of mean reversion, which is where the price moves back to more normal or average levels after pulling away from the average.
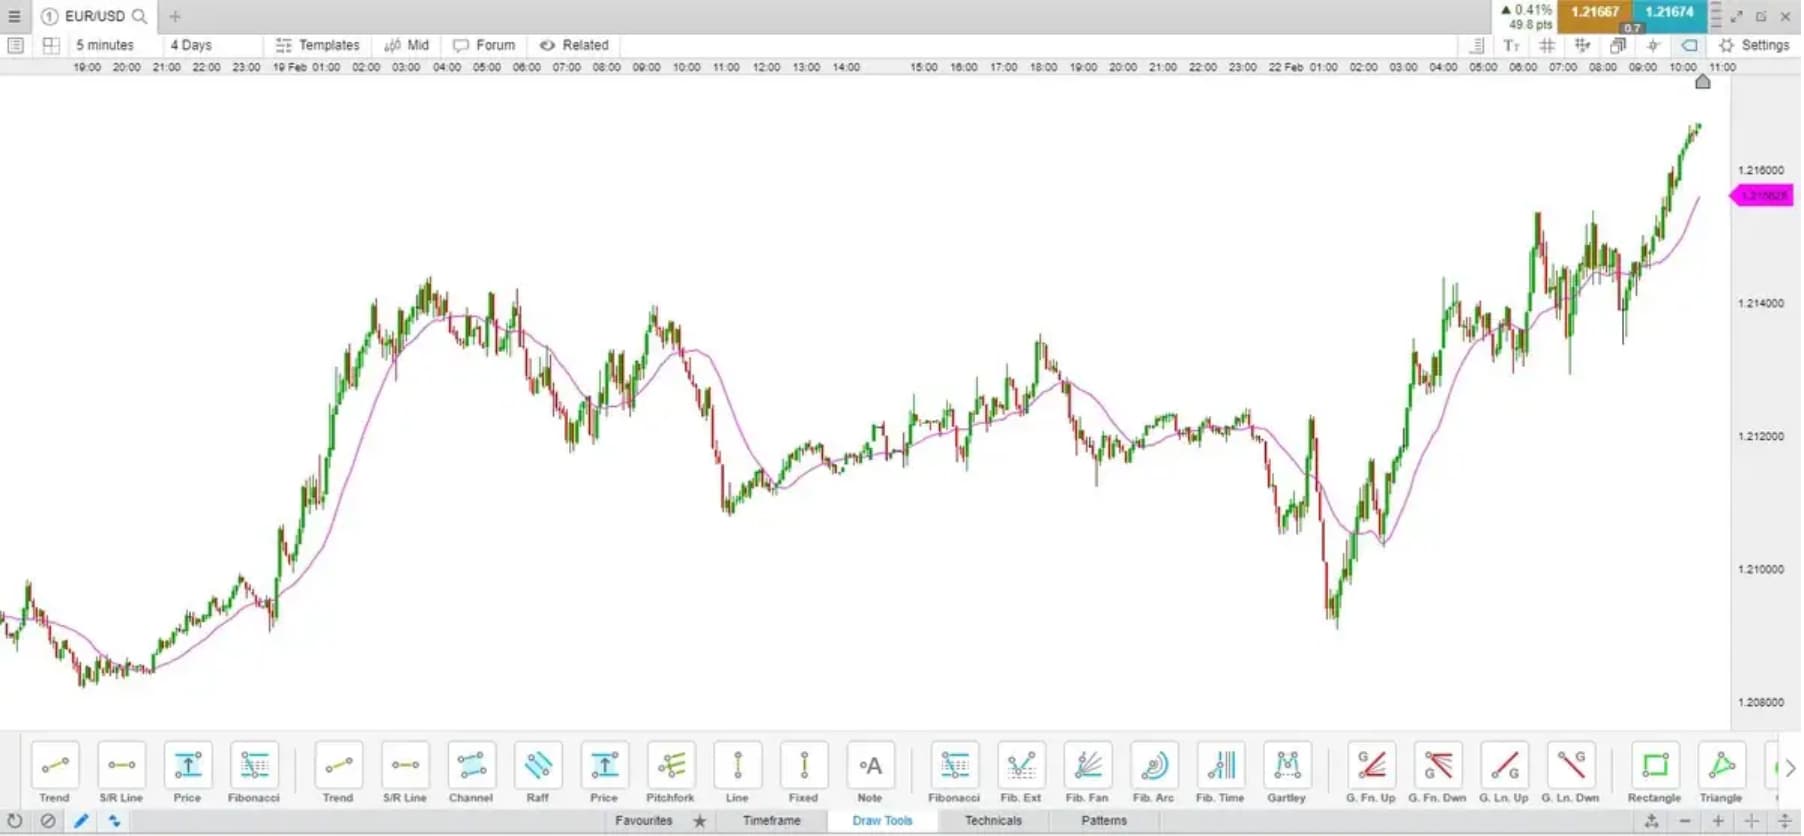
The following chart shows that a simple moving average (SMA) is both lagging and leading in that it moves with price, but in a delayed fashion, and it also acts as a moving target (leading) for where the price could go next because of the tendency for the price to return to the average.
The longer the moving average — the more periods used in its calculation — the less frequently the price will revisit the moving average. The shorter the moving average, the more frequently the price will revisit the moving average.
Leading indicator: stochastic oscillator
The stochastic oscillator is mainly used to highlight when the price may be overextended and could reverse. In this capacity, it acts as a leading indicator.
Once again though, in absolute terms, the stochastic is a lagging indicator as it is comparing the current closing price to the closing prices of prior price bars/candles, and therefore, the indicator will also slightly lag behind price.
The stochastic oscillator highlights overbought and oversold areas for potential buy and sell actions in ranging assets, or assets that are moving relatively rhythmically higher and lower.
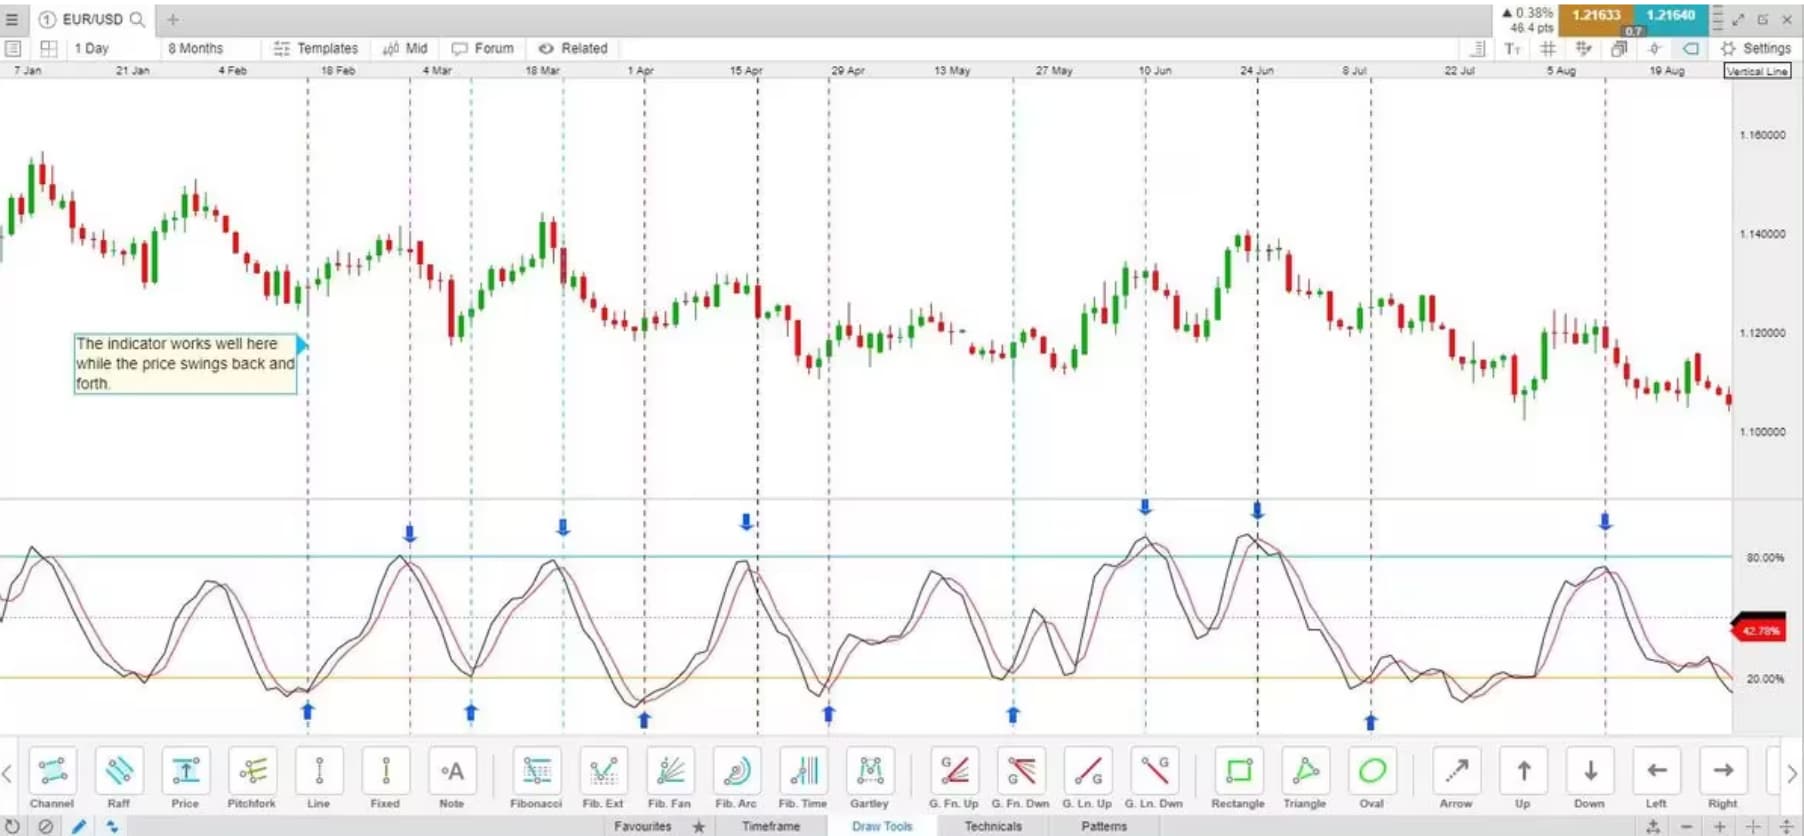
A stochastic will provide overbought and oversold levels during a trend as well, although overbought in an uptrend may not indicate that a reversal is forthcoming, for example. This is because, in trends, the price can stay overbought or oversold for extended periods of time.
The indicator may also not work well for choppy price action, when the price is moving up and down quickly. Because of the delay in the indicator, trades may be entered right when the price is about to reverse again.
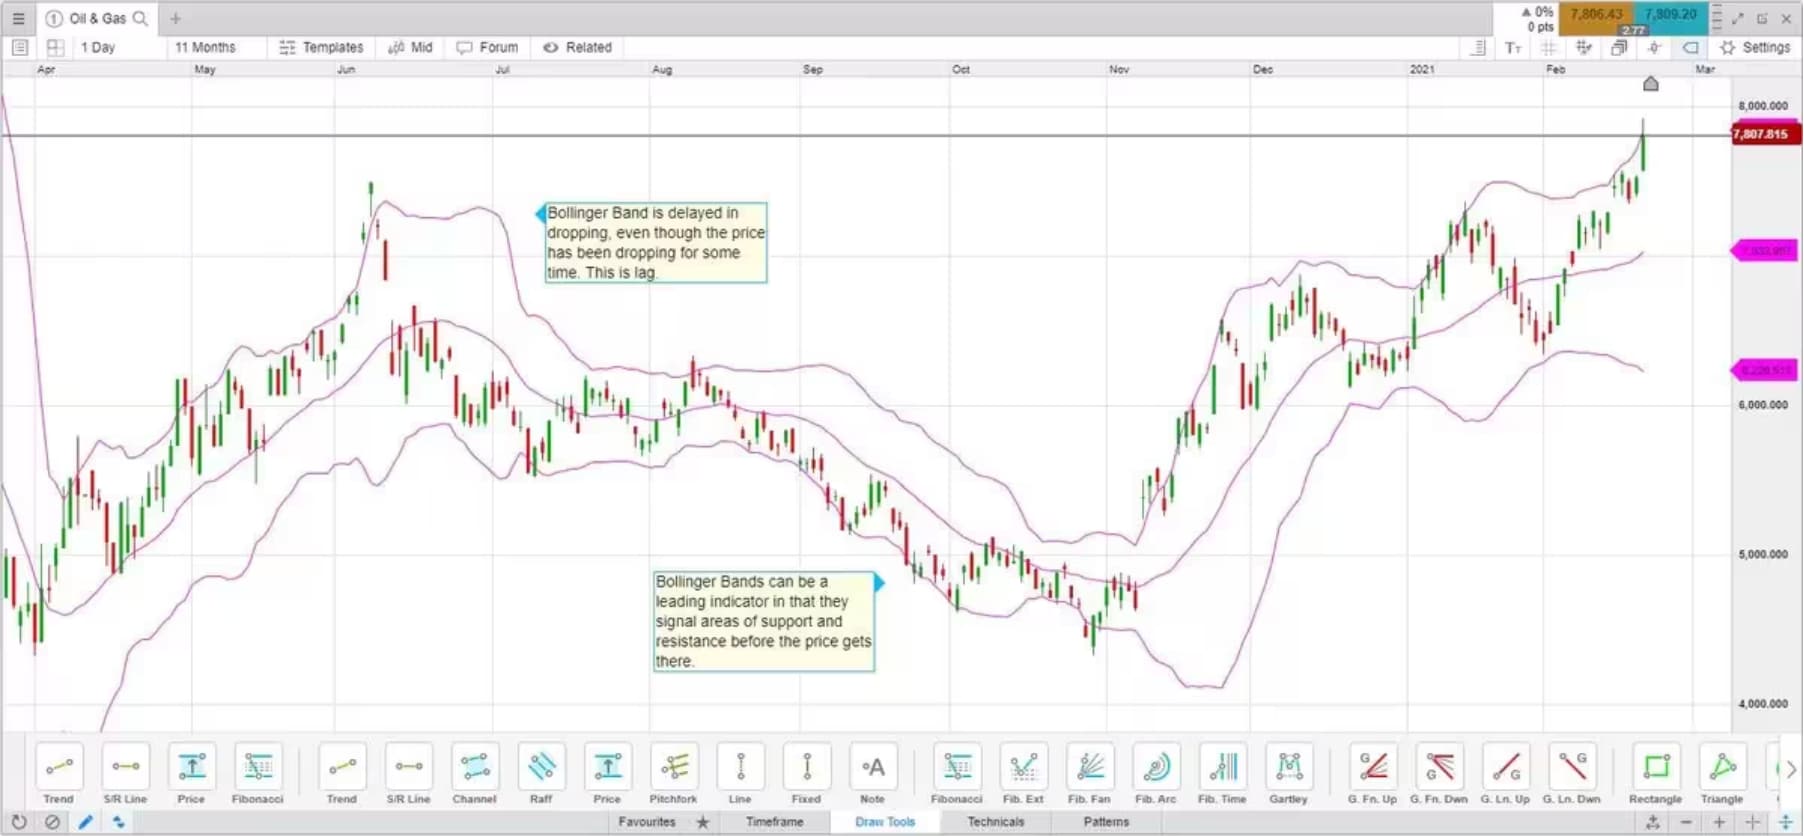
Lagging indicator: Bollinger Bands
As with the other indicators discussed so far, Bollinger Bands are inherently lagging because the indicator only reacts after the price moves. However, Bollinger Bands have a moving average and outer bands that can act as a leading indicator, as they help to identify areas where the price may stall or reverse.
On the chart below, we can see that the Bollinger Bands are slightly delayed in reacting to price fluctuations. That said, the bands can help to identify areas of dynamic support and resistance as the price moves.
Leading vs lagging indicators
When building a trading strategy, some traders opt for a combination of leading and leading technical indicators. Some prefer only leading, while others use lagging. Pure price action traders prefer to not use indicators at all and instead focus on analysing the price charts manually.
It is not so much how an indicator is classified (leading or lagging) that matters, rather how the indicator is used and interpreted by the individual. Both types of indicators have their uses and tell traders something about the price action. Leading is not better than lagging, or vice versa. When using any type of technical indicator or trading strategy, it is important to incorporate risk controls on each trade in case the price doesn’t move as expected.
Risk controls include the use of a stop-loss order, which exits the trade if the price moves in the opposite direction by a specified amount. However, stop-loss orders do not take into account market volatility, such as slippage or gapping on price charts. Another form of risk control is position sizing. Proper position sizing ensures that not too much capital is put at risk on each trade. Capital can be spread out over multiple trades, or if all the capital is used for one trade, a stop-loss could be placed so that only a small portion of that capital is at risk of being lost.
One of the main drawbacks of any indicator is the possibility of producing false signals. A false signal is when the trader interprets an indicator but the price doesn’t move as expected. For example, if an RSI is overbought and starts turning lower, this could be interpreted as a sign to sell or short sell. Yet, the price may continue going higher. This is a false signal, which is another reason for why risk controls are required when trading.
How to trade with leading and lagging indicators
On our Next Generation trading platform, we offer a wide range of technical indicators that can be applied to over 10,000 assets, including shares, currencies, commodities, share baskets, ETFs and indices. Some popular leading and lagging indicators that are available for trading include:
Bollinger Bands
Relative strength index (RSI)
Moving averages (simple and exponential)
Keltner channels
Moving average convergence divergence (MACD)
Parabolic SAR
Average true range (ATR)
Pivot points
We also offer a wide range of drawing tools that can be applied to your trading charts, such as Fibonacci retracement and extension tools, regression lines and Gann lines. Traders can draw trendlines, make notes on price action, apply pattern detectors and take advantage of more than 20 other analytical drawing tools before making trading decisions.
Open an account to get started and explore our award-winning platform*.
*No1 Web-Based Platform, ForexBrokers.com Awards 2020; Best Telephone & Best Email Customer Service, based on highest user satisfaction among spread betters, CFD & FX traders, Investment Trends 2020 UK Leverage Trading Report; Best Platform Features & Best Mobile/Tablet App, Investment Trends 2019 UK Leverage Trading Report.


Ready to get started?
Disclaimer: CMC Markets is an execution-only service provider. The material (whether or not it states any opinions) is for general information purposes only, and does not take into account your personal circumstances or objectives. Nothing in this material is (or should be considered to be) financial, investment or other advice on which reliance should be placed. No opinion given in the material constitutes a recommendation by CMC Markets or the author that any particular investment, security, transaction or investment strategy is suitable for any specific person. The material has not been prepared in accordance with legal requirements designed to promote the independence of investment research. Although we are not specifically prevented from dealing before providing this material, we do not seek to take advantage of the material prior to its dissemination.