
How to trade with Fibonacci retracements
Fibonacci retracements are a popular form of technical analysis used by traders in order to predict future potential prices in the financial markets. If used correctly, Fibonacci retracements and ratios can help traders to identify upcoming support and resistance levels based on past price action.
How to trade with Fibonacci retracements
Fibonacci retracements are a widely used tool in technical analysis, helping traders identify potential support and resistance levels based on past price movements.
Fibonacci retracements are often used as a confirmation tool, but they do not reliably predict price movements and should not be used as a standalone trading signal. Traders often combine Fibonacci levels with indicators such as trend lines, volume, moving average convergence divergence (MACD), and moving averages to assess possible trade signals.
Key idea: The more confirmation signals that align, the stronger the trade setup is likely to be, but Fibonacci levels should still be used alongside risk-management rules. [1]
What is Fibonacci trading? Key concepts explained
Fibonacci trading uses ratios derived from the Fibonacci sequence, which is named after Leonardo Fibonacci, the Italian mathematician who helped popularise the sequence in Europe. In the sequence, each number is the sum of the two preceding numbers, for example 0, 1, 1, 2, 3, 5 and 8. [2]
In trading, this sequence is used to derive key ratios that help identify potential turning points in price action.
The most important Fibonacci retracement levels are:
23.6%
38.2%
50% (not a true Fibonacci ratio, but widely used)
61.8%
78.6%
These levels are plotted between a significant high and low on a chart to identify where price may retrace before continuing in its original direction.
Although the mathematical origins may seem abstract, these levels are widely followed by traders, which contributes to their relevance in the markets.
Fibonacci's golden ratio
The most important concept in Fibonacci trading is the golden ratio (1.618).
As the sequence progresses, dividing one number by the previous number approaches 1.618, while its inverse (0.618) forms the basis of the key retracement level (61.8%).
This ratio appears frequently in nature, architecture, and biology—and is also applied in financial markets through technical analysis.
In trading terms:
61.8% → major retracement level
38.2% → moderate retracement
23.6% → shallow retracement
Additional levels such as 161.8% are used for extensions (profit targets).
Fibonacci retracement levels explained with examples
Fibonacci retracement levels are used to estimate where a market pullback might end before the trend resumes.
How it works in practice:
In an uptrend → traders look for support at Fibonacci levels
In a downtrend → traders look for resistance
For example:
A market rises strongly
It begins to pull back
Traders apply Fibonacci levels to the move
They monitor key levels (38.2%, 50%, 61.8%) for potential reversals
These levels often act as decision zones, rather than exact price points.
Fibonacci retracements can be applied across all timeframes and asset classes, including forex, shares, indices, and commodities. They are also commonly used alongside tools like the Elliott Wave principle.
What is the Fibonacci sequence?
In trading, the Fibonacci sequence is used to derive ratios that help identify hidden support and resistance levels.
The most used levels:
23.6%
38.2%
50%
61.8%
Example of price behaviour:
Price retraces to 38.2% → potential bounce zone
Break below 38.2% → next level to watch is 50%
Break below 50% → focus shifts to 61.8%
If price moves beyond 61.8%, traders may interpret this as a trend of weakening or reversing.
What is the Fibonacci sequence used for?
Fibonacci ratios are used by some traders to assess possible entry areas, target areas and support or resistance zones. These levels are analytical estimates rather than direct buy or sell signals.
How to use Fibonacci retracements in trading
Analytical checklist:
Identify a trend
Determine whether the market is trending up or down.Select key points
a. Uptrend → draw from low to high
b. Downtrend → draw from high to lowPlot Fibonacci levels
Use charting tools to automatically display retracement levels.Watch key levels
Focus on 38.2%, 50%, and 61.8% as potential reaction zones.Look for confirmation
Combine Fibonacci levels with indicators like MACD, trend lines, or candlestick patterns.Plan the trade
a. Entry near a Fibonacci level
b. Stop-loss beyond the next level
c. Target based on prior highs/lows or extensions
Modern trading platforms make it easy to apply Fibonacci tools directly to charts.
Using Fibonacci for support and resistance levels
Fibonacci levels are most used to identify support and resistance zones.
Example setups:
Uptrend strategy: Wait for price to retrace to 38.2% or 61.8%, then look for buying opportunities
Downtrend strategy: Wait for price to retrace upward to key levels, then look for selling opportunities
These setups are typically used after a clear upward or downward trend has formed, with the retracement helping traders identify possible support or resistance before the trend resumes. [3]
Real examples of Fibonacci trading patterns
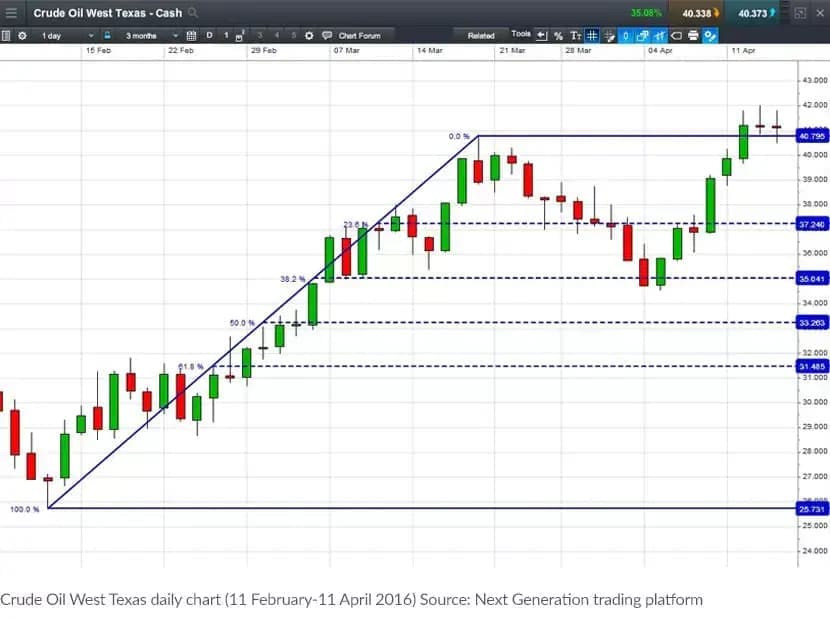
Example 1: Uptrend retracement
Crude Oil (WTI) rises strongly, then pulls back.
Price retraces to the 38.2% level
Support forms
Trend resumes upward
This shows how Fibonacci levels can act as entry zones in trending markets.
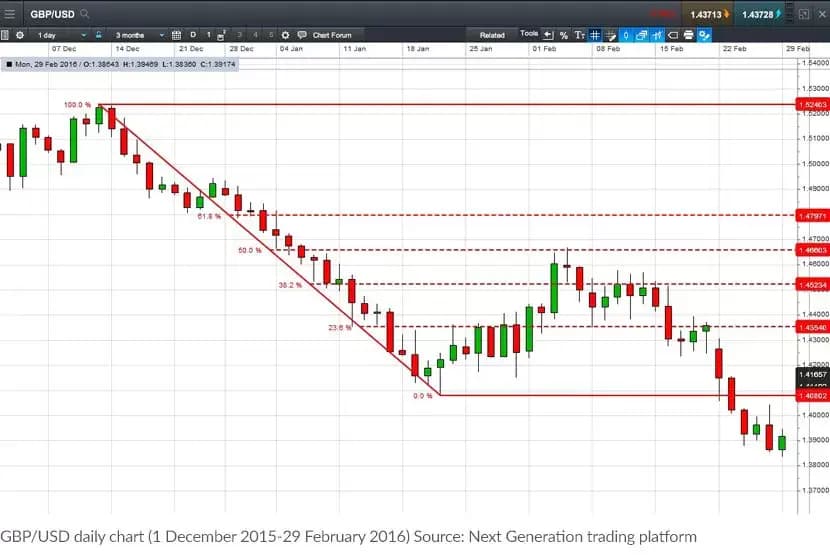
Example 2: Downtrend retracement
GBP/USD falls significantly, then rebounds.
Price retraces to the 50% level
Resistance forms
Downtrend resumes
This demonstrates how Fibonacci retracements can help identify short-selling opportunities.
Fibonacci trading strategies: setups and techniques
A trend continuation approach looks at whether price retracements align with the wider trend. Some traders also compare Fibonacci levels with indicators such as MACD or stochastic oscillators.
Multi-timeframe analysis
Some traders review higher timeframes to understand the broader market context before looking at shorter-term price movements.
Read more about choosing the right chart timeframes.
Practical insight:
Fibonacci works best when:
The market is trending
Multiple indicators confirm the level
Risk management rules are applied
The more confirmation signals that align, the stronger the trade setup is likely to be, but Fibonacci levels should still be used alongside risk-management rules. [4]
Open an account to get started with Fibonacci trading.
Summary
Fibonacci retracements are a powerful tool for identifying potential turning points in the market. While some traders view them as self-fulfilling, their widespread use makes them relevant in real trading conditions.
The key to using Fibonacci effectively is:
combining it with other indicators
applying it within a structured strategy
managing risk carefully
1 Source: CMC Markets, How to trade with Fibonacci.
2 Sources: Charles Schwab, Using Fibonacci Retracement Levels; Encyclopaedia Britannica, Fibonacci biography.
3 Source: CMC Markets, How to trade with Fibonacci.
4 Source: CMC Markets, How to trade with Fibonacci.

