Spread bets and CFDs are complex instruments and come with a high risk of losing money rapidly due to leverage. 67% of retail investor accounts lose money when spread betting and/or trading CFDs with this provider. You should consider whether you understand how spread bets, CFDs, OTC options or any of our other products work and whether you can afford to take the high risk of losing your money.

How to start trading

It can be difficult to get started trading with a new broker, particularly when it comes to familiarising yourself with the platform and its range of technical features. Therefore, we have put together a complete guide on how to start trading on our award-winning platform​*, Next Generation.

This article, along with its various video tutorials, will take you through the process of finding instruments to trade, setting up customisable charts and technical analysis features, and placing spread bet and CFD orders. We offer over 10,000+ financial instruments to trade on within the forex, index, share, commodity and treasury markets, as well our own exclusive share baskets and commodity and forex indices.

See inside our platform

Get tight spreads, no hidden fees and access to 10,000+ instruments.

1. Getting started with trading

Given that spread betting is our most popular product and it is also a tax-free** method of trading in the UK and Ireland, we will demonstrate how our platform works through a live spread betting account. To learn how to place spread betting order tickets on our platform, consult our spread betting guide​​. Alternatively, you can also trade contracts for difference on the exact same asset classes.

Finding instruments to trade

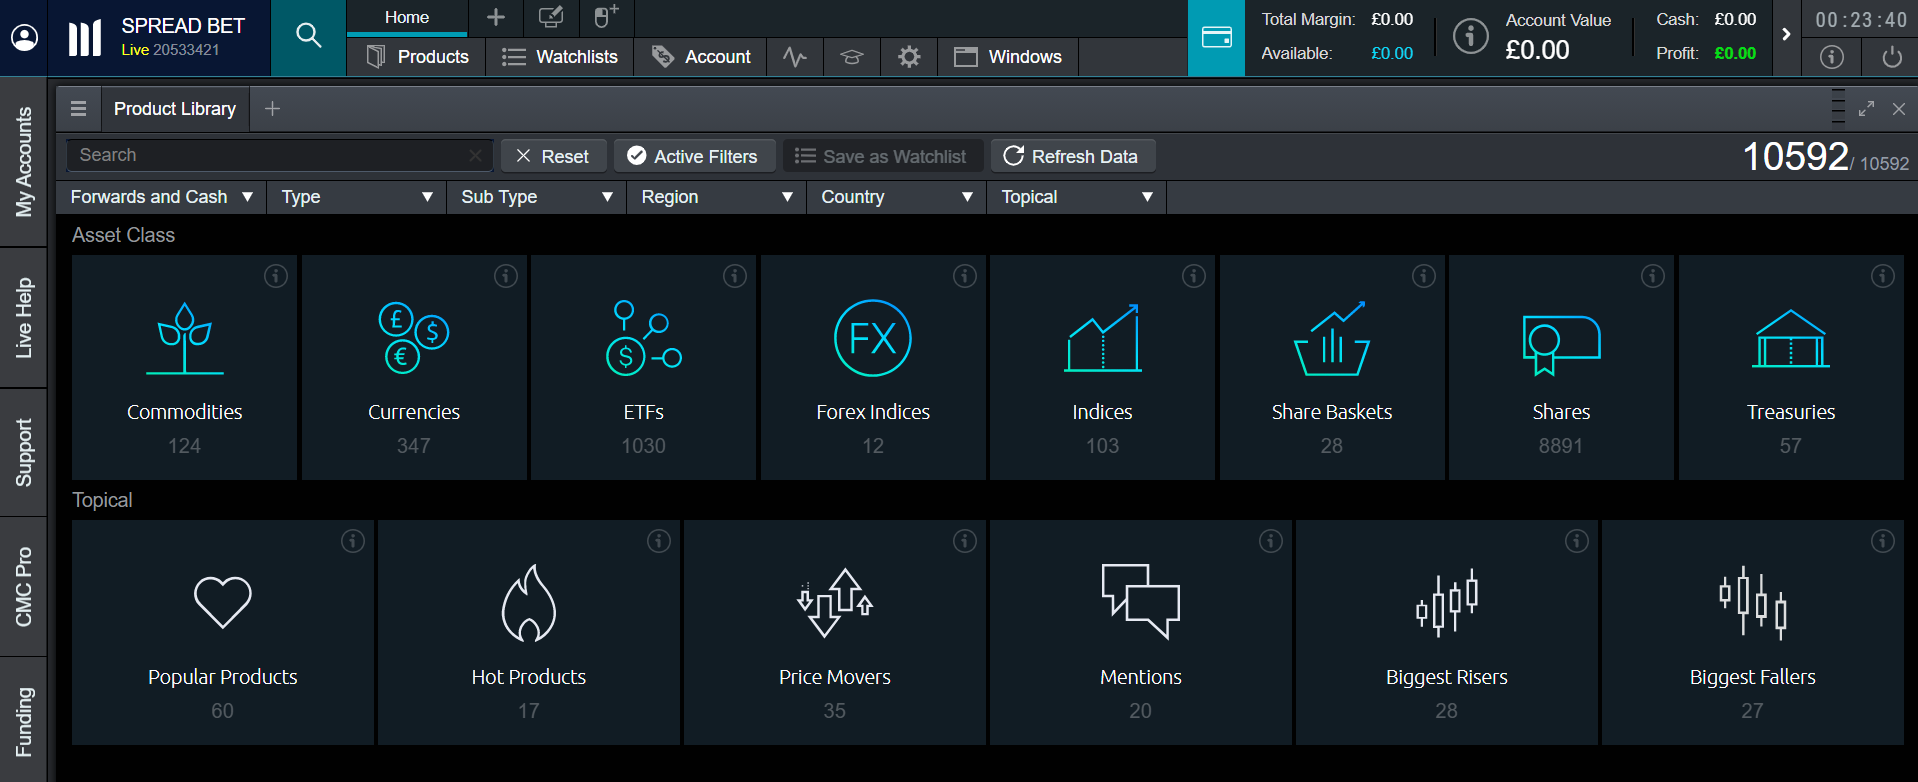
After registering for an account, you will be directed to the Next Generation homepage. Click on the ‘Products’ tab and select ‘Library’ to browse through more than 10,000 financial instruments. Our asset classes are listed in sections below, but you can also type into the search bar to find the exact instrument that you are looking for.

When browsing the product library, there are many options to filter by. You can choose between cash and forward instruments, asset class (type), sector or industry (sub-type), region and specific country. We also offer topical categories. Our ‘Hot Products’ section is based on instruments whose recent trade volume has increased significantly versus the monthly average, whereas the ‘Price Movers’ shows particularly volatile price movements.

Share baskets are exclusive to CMC Markets’ clients. These allow you to trade on a basket of stocks that fall under a relevant theme, including Big Tech, Driverless Cars, Renewable Energy, 5G and Oil & Gas. In comparison to trading on individual shares, share baskets come with lower holding costs and zero commission fees. These can also help to diversify your portfolio. Learn more about thematic investing.

Exploring our range of chart types

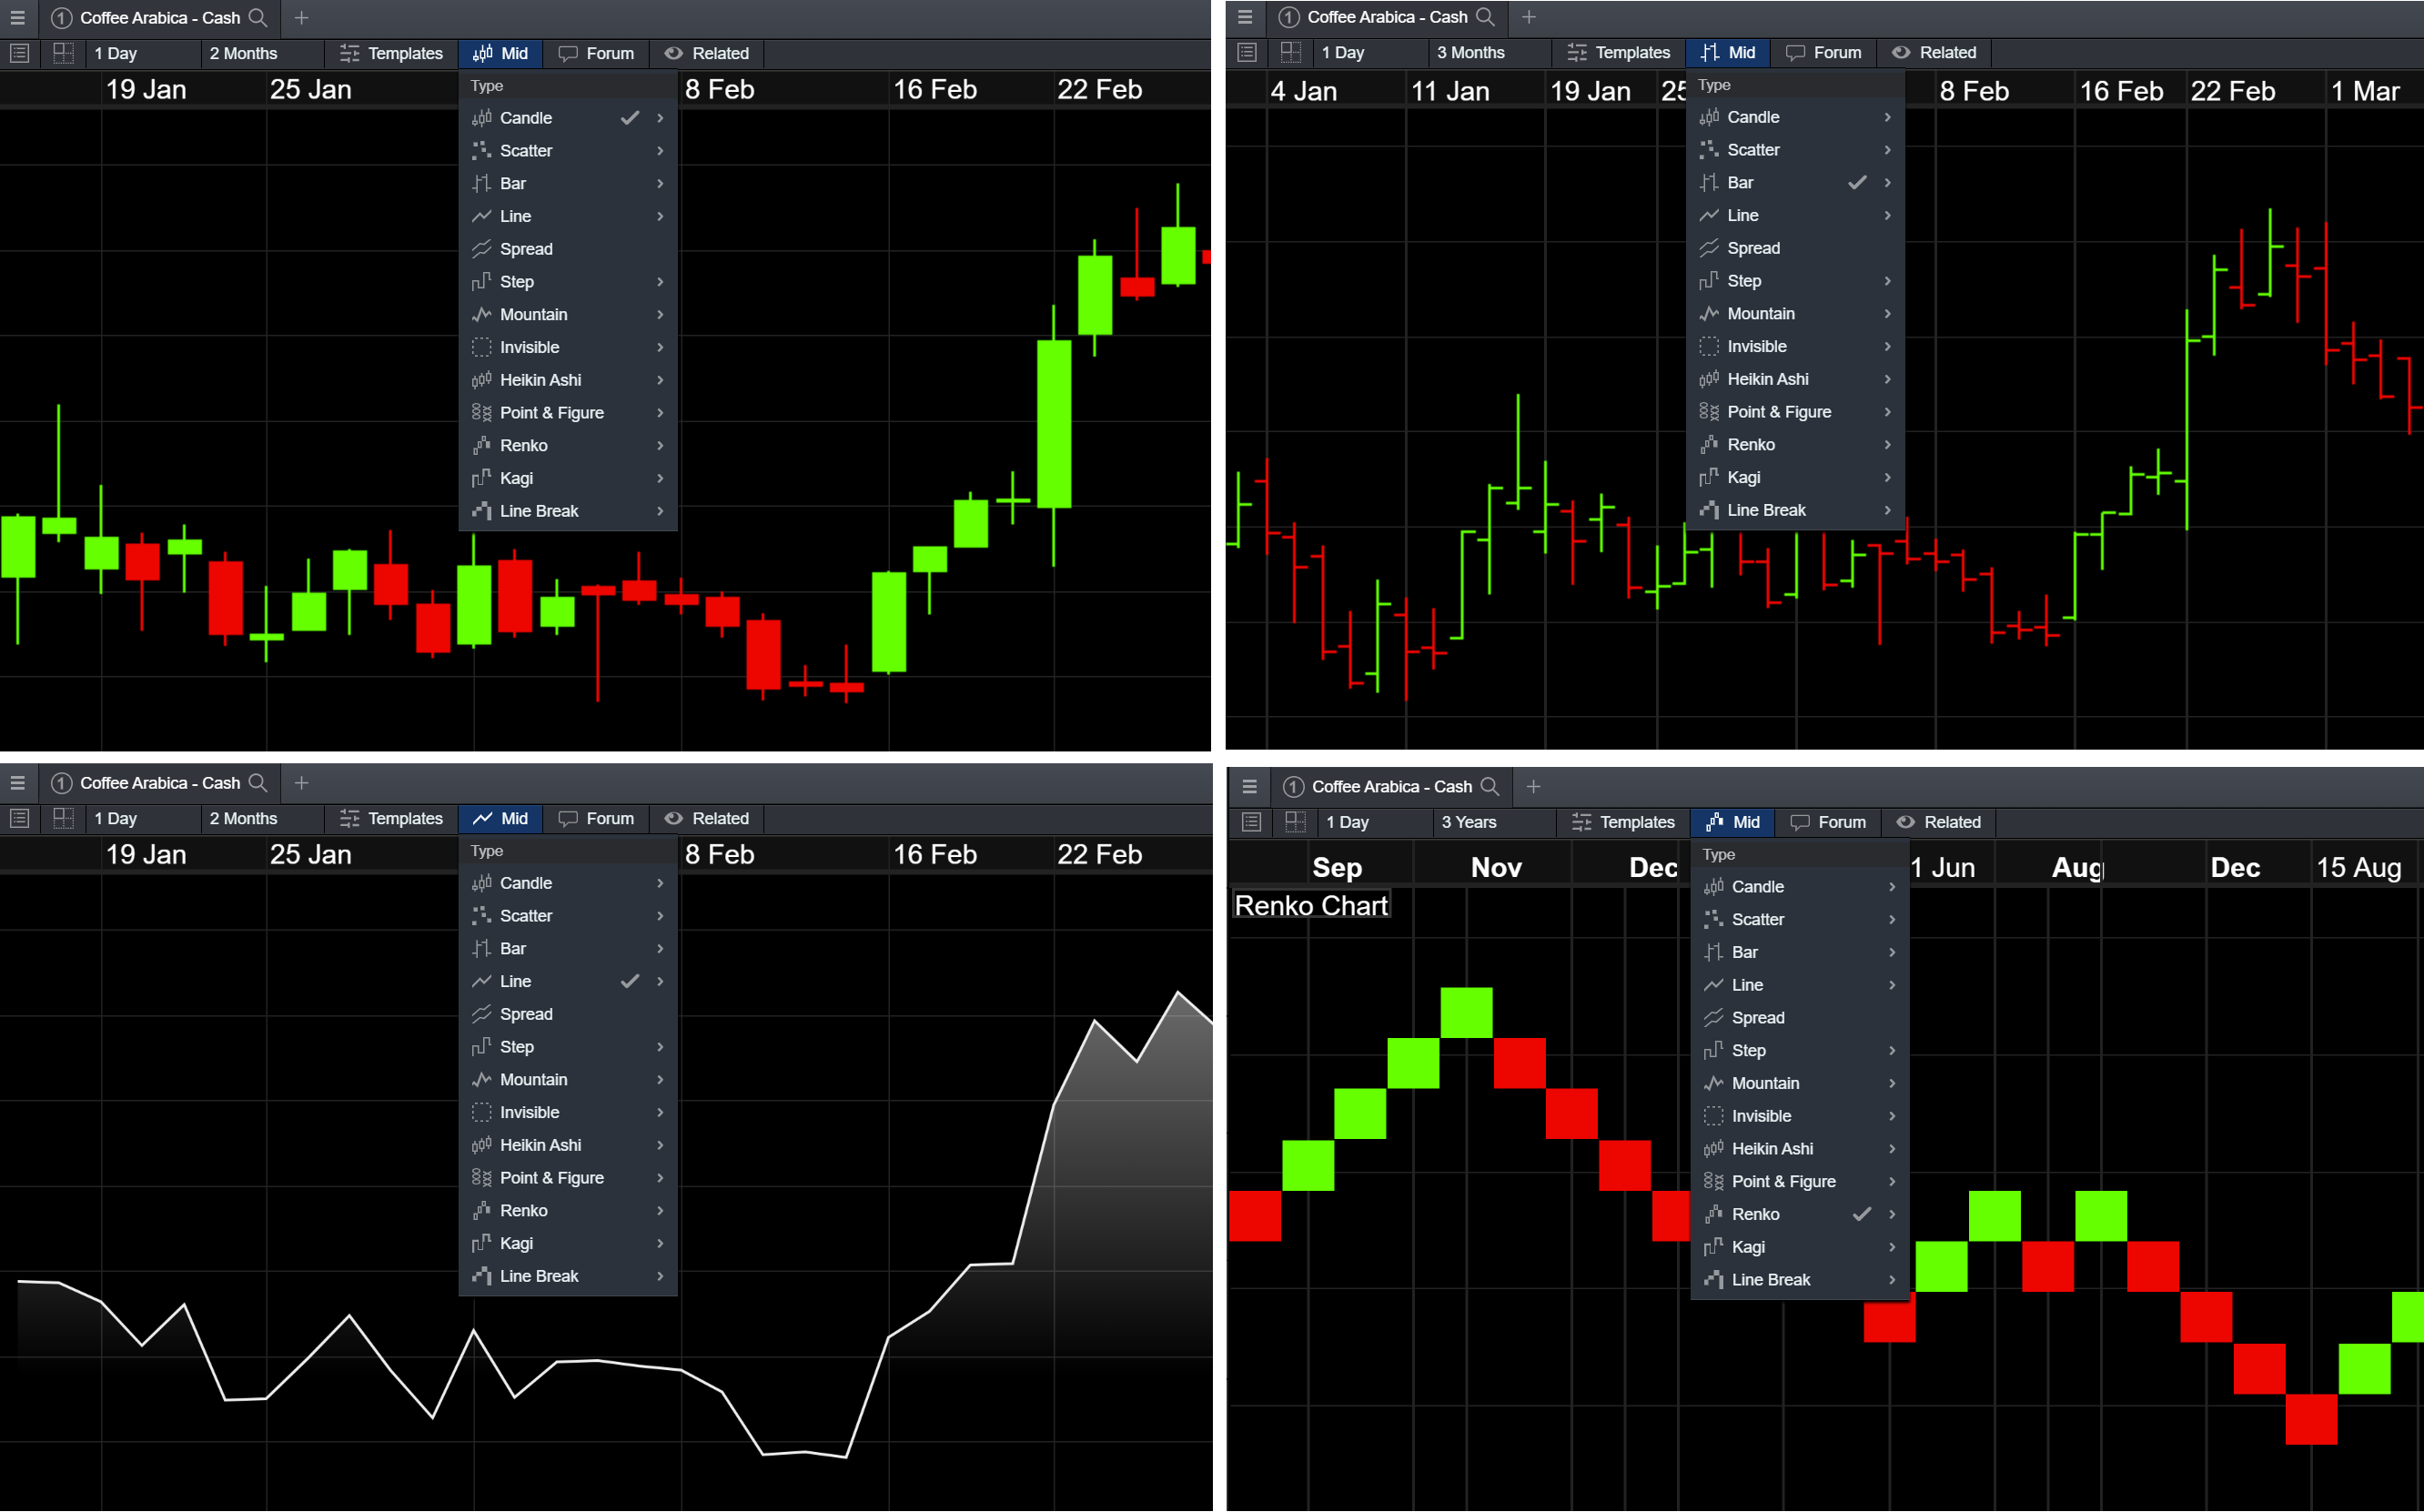
We offer a number of trading chart types​ to display price data. Select the instrument that you want to spread bet or trade CFDs on and open its trading chart. Then, click on the chart graphic. Among these chart types including popular candlestick, line, bar and Renko charts. There are also more analytical chart forms, such as point and figure, Heikin Ashi and scatter graphs.

Chart types clockwise from top left: candlestick, bar, Renko, line

These charts can be analysed in various timeframes, depending on whether you are employing a short-term or long-term strategy. For example, if you choose to use a scalping strategy​ for a popular forex pair, you could set the time interval in the first tab to 5, 10 or 30 seconds, allowing you to capitalise on small price movements. If you choose to use a position trading strategy for a blue-chip stock, you could set the time history in the second tab to 1, 3 or 6 months, allowing you to grasp the overall trend and direction of the chart. Learn about trading on different chart timeframes​.

Placing orders

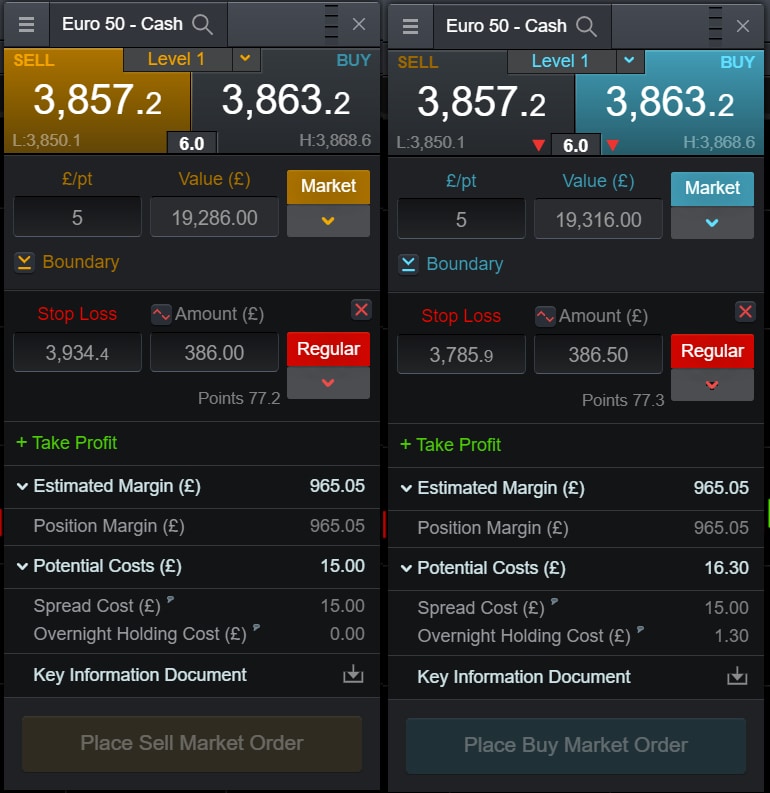
To place a spread bet or CFD order, you can do so directly from the chart by clicking on the icons on the right-hand side. This will open an order box. The spread is the difference between the bid and ask price for the instrument, which is displayed in the middle of the buy and sell boxes. In the below case, this is shown as 6.0. Estimated margin costs, spread costs and overnight fees are automatically calculated on the ticket before you place the order. You must have sufficient funds in your account to cover these fees at all times. Read more about our trading costs​.

As all instruments require the use of margin (or leverage), with differing percentages, you do not have to pay the full value of the position upfront. Margin trading comes with many risks, so it is important that you understand the risks of leverage​ before placing an order.

2. Getting started with Next Generation

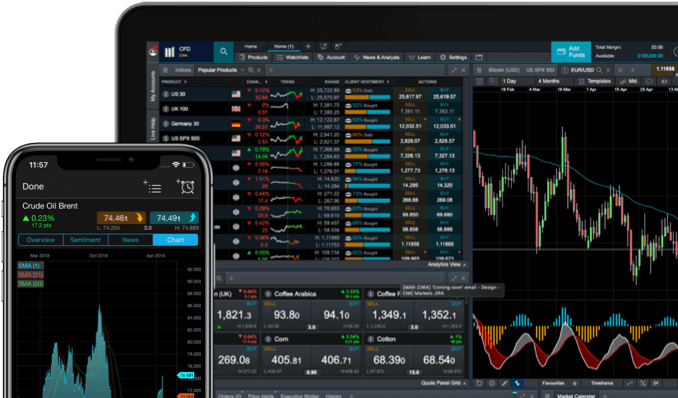
Our Next Generation platform offers advanced trading software for desktop, mobile and tablet devices. This is based on more than 30 years of experience within the industry. See our key platform features to make the most of your trading account.

Multiple order types

When placing a spread bet or CFD order, you can choose between a market, limit or stop-entry order. Market orders​ aim to open a position as quickly as possible at the prevailing price. With limit orders, you can specify the minimum or maximum price that you are willing to buy or sell an asset for, and the order will not be placed until it reaches this price. Stop-entry orders are similar to the latter and are usually used when market value is declining, in order to capture momentum at the start of a new trend.

We also offer a number of stop-loss orders to help manage risk. In particular, guaranteed stop-loss orders take into account market volatility, gapping and slippage on price charts for a small premium fee, ensuring that you will be closed out of a position at the price you specify. It is important to learn about risk-controls, especially in volatile markets.

It is possible to open a demo account and practise trading with £10,000 worth of virtual funds before committing to the live markets.

One-click trading

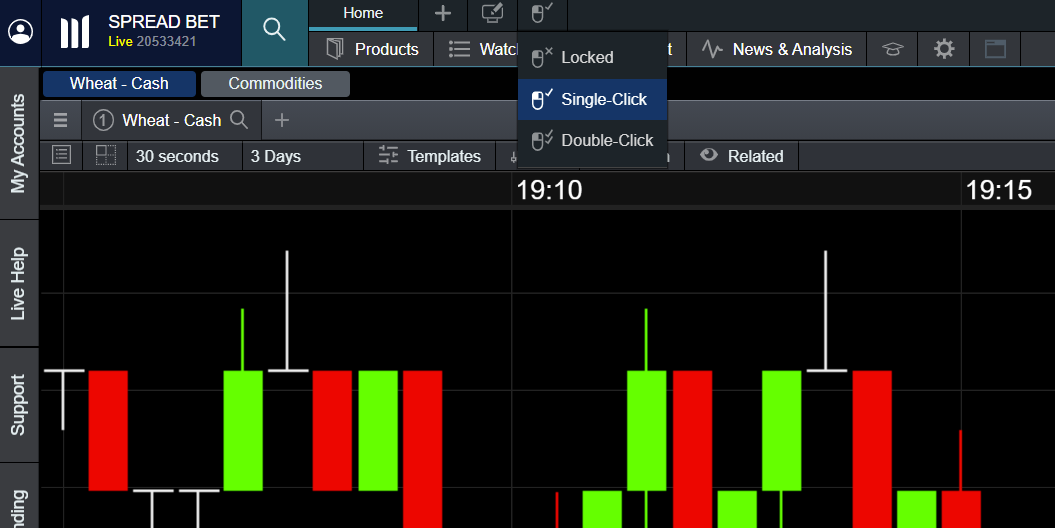
One-click trading is a technical feature that allows you to open and close trades with just one click, skipping the order ticket process. This is commonly used by more experienced or professional traders on our platform, as it helps to simplify the process and speed up execution of trades.

Please note that once an order is placed with one-click trading, you will not have a chance to cancel the order, so you should take extreme care when using this feature. Watch our video tutorial on one-click trading​ to get started.

Trading on mobile and tablet

Our award-winning platform is also available for trading on-the-go through mobile and tablet devices for both iOS and Android systems. Advanced order ticketing, mobile optimised chart layouts and a customisable dashboard are some of the features that make trading on our app so seamless. Our advanced technology ensures that you can continue setting orders and exploring our product library from anywhere, at any time, without missing out on important platform features.

3. Technical and fundamental tools

For all trading strategies and financial markets, it is sensible to use a combination of fundamental and technical analysis in order to strengthen your knowledge of trading. In this section, we will explore trading indicators, tools and reports that make up a significant part of the platform.

Trading indicators and drawing tools

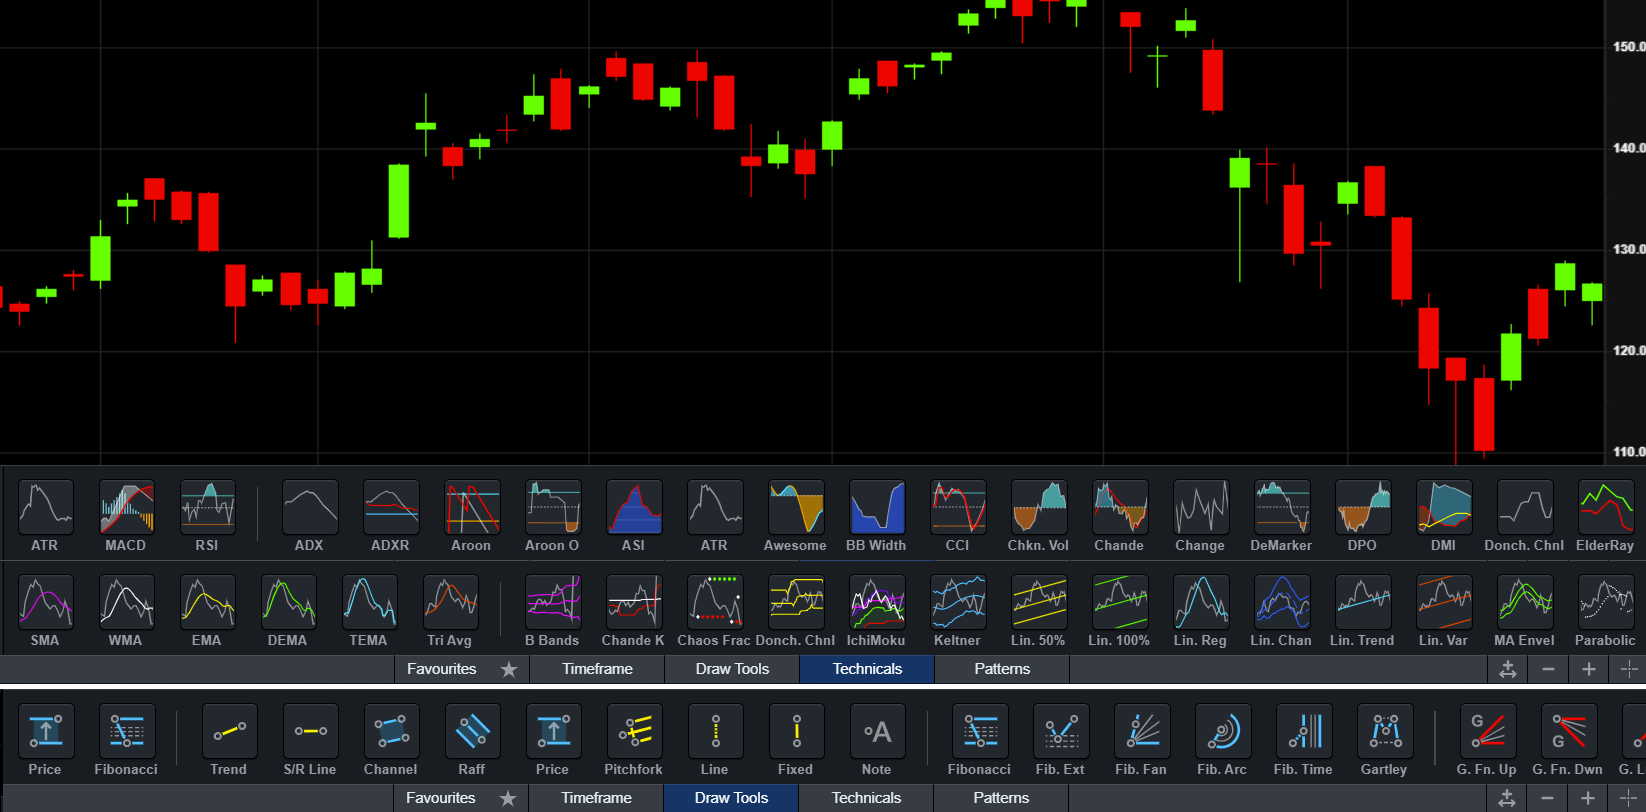
We offer a wide range of trading indicators​ that can be applied to any price chart. These are both leading and lagging indicators. As shown below, our range of indicators include popular choices Bollinger Bands, moving averages (simple and exponential), Keltner channels, moving average convergence divergence (MACD) and Awesome oscillator​​.

You can apply one or more technical indicator at a time in order for separate analyses of the instrument, such as momentum, trend direction and trend strength.

There are also draw tools that traders can apply to the chart manually. These include technical aspects such as trendlines ​and trend channels, support and resistance levels and Fibonacci retracements. There are also more simple draw tools such as buy and sell arrows and price projection boxes, which you can use to highlight possible entry and exit points on the chart.

Technical analysis tools

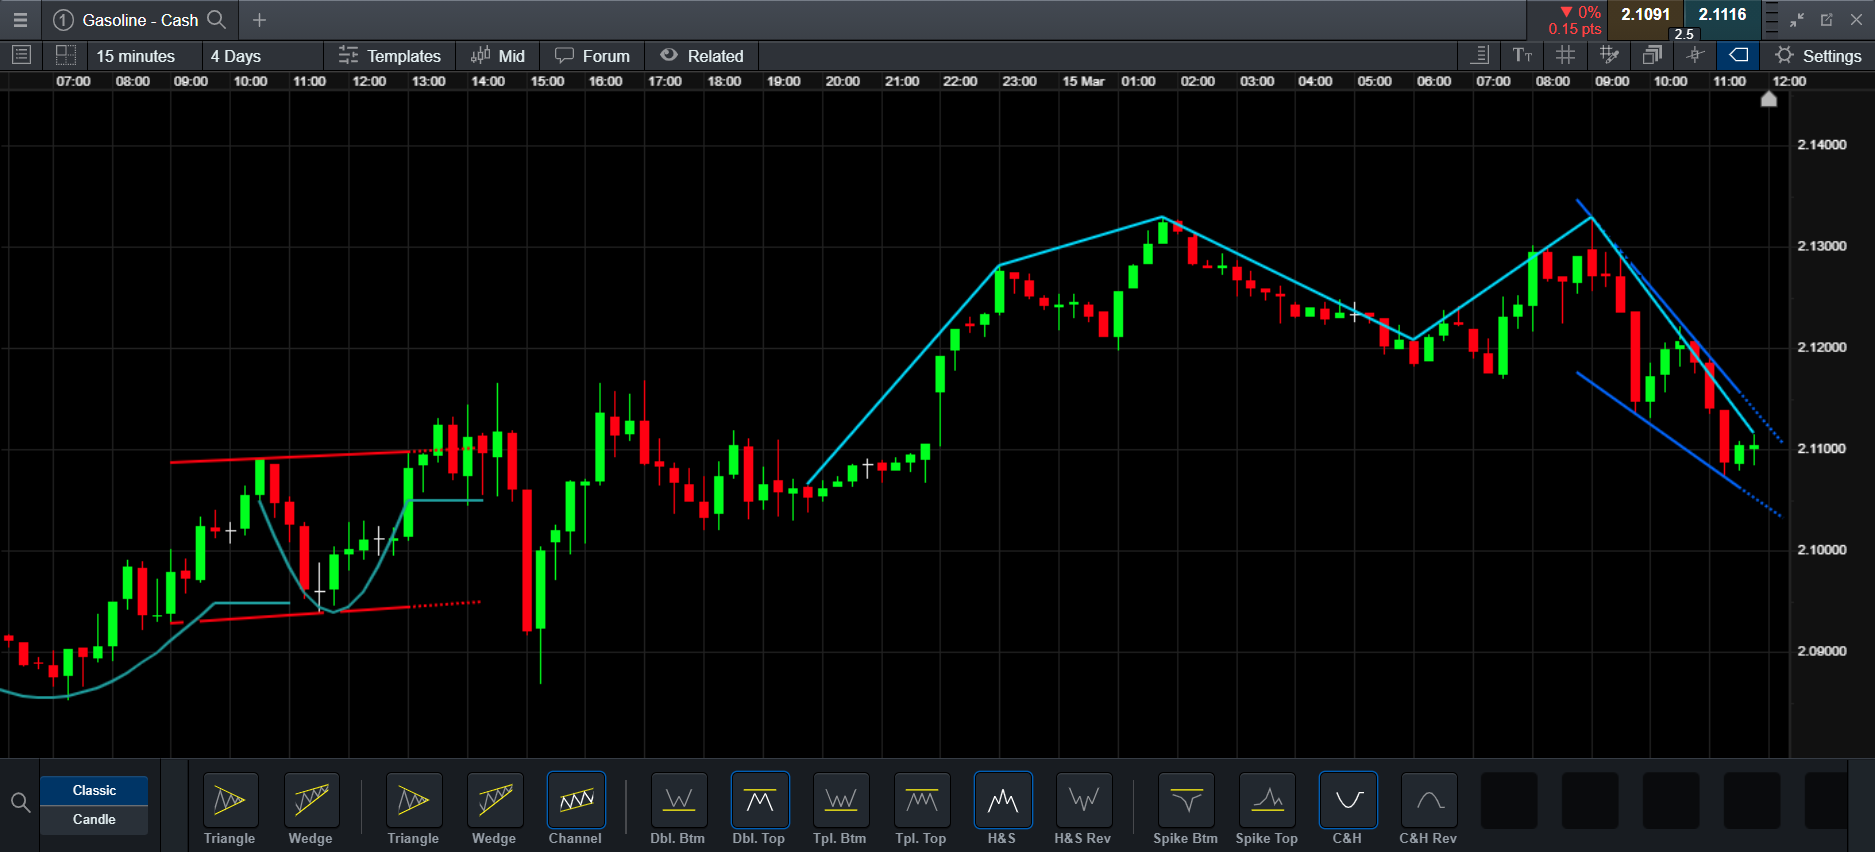
Our Next Generation platform comes with an assortment of trading tools, which are valuable for technical analysis. This includes an automatic pattern recognition scanner to identify important trading patterns that may appear on price charts. Wedges, channels and triangles are examples of basic patterns, while head and shoulders, cup and handle and harmonic patterns are examples of more complicated patterns. These can all help to highlight possible entry and exit points for a trade, and also where to set stop-loss and take-profit orders for risk management. Learn more about our chart pattern scanner​.

You can search for instruments that have shown recent breakout and emerging patterns in the ‘News & Analysis’ tab, which will be applied automatically to their price chart, or you can apply them manually through the ‘Patterns tab’ at the bottom of the price chart.

Fundamental analysis tools

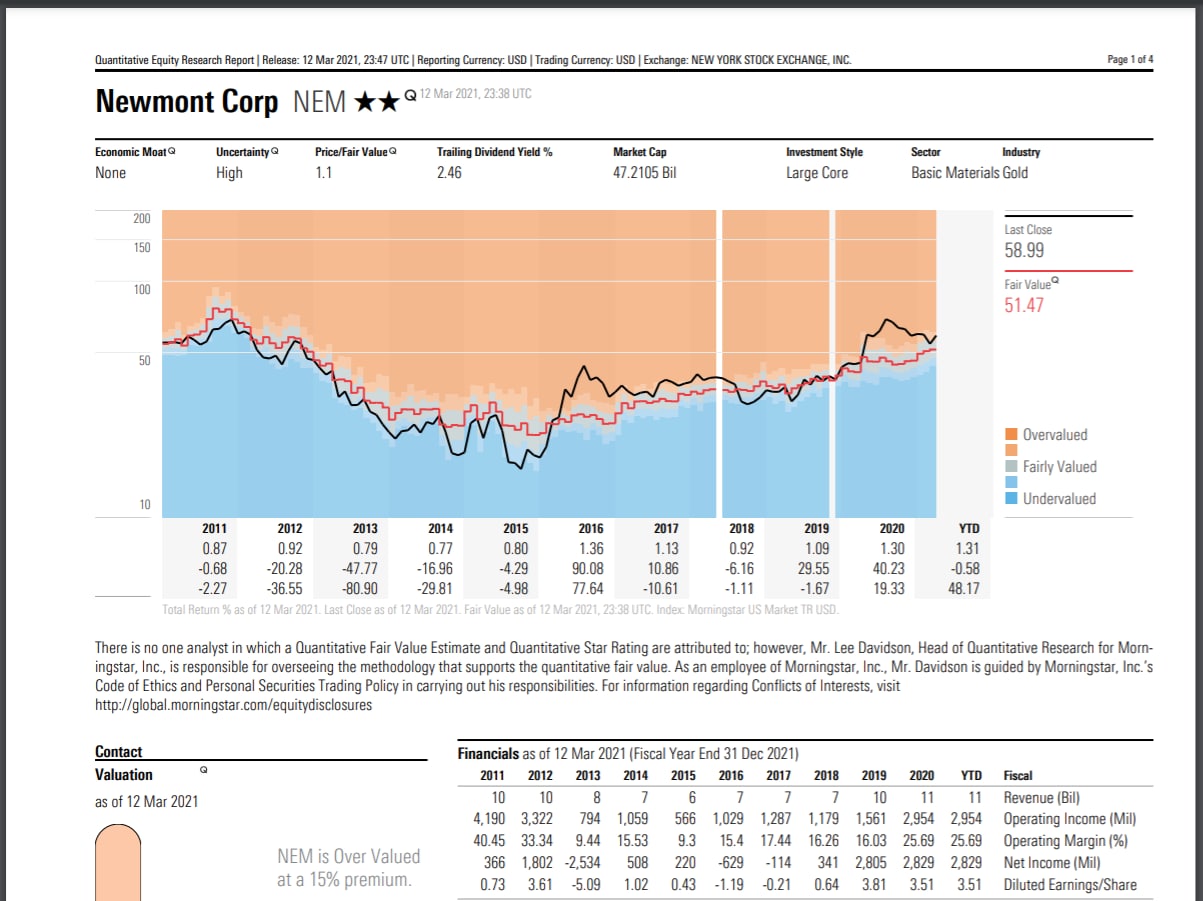
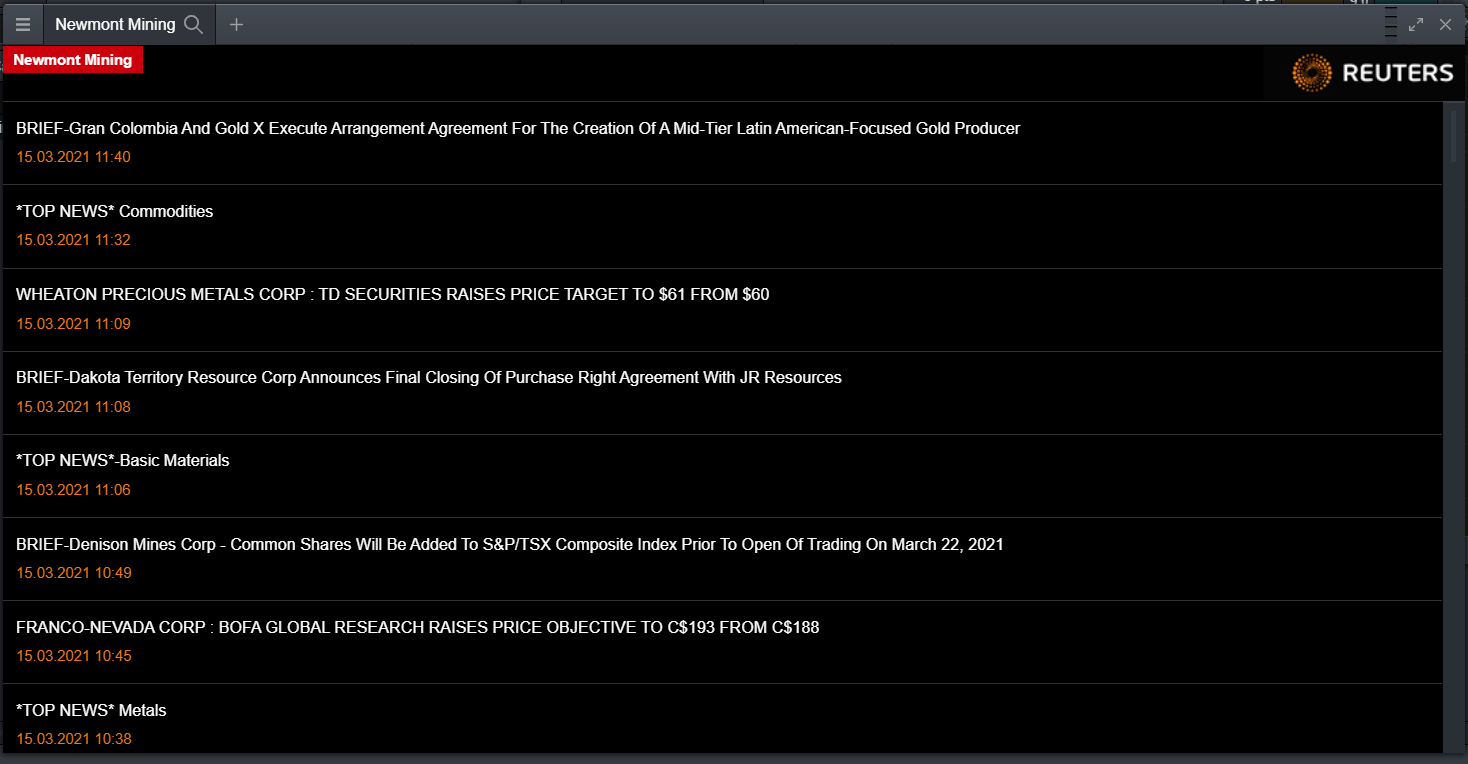
Fundamental analysis is a vital aspect of trading, particularly for long-term or buy and hold strategies. Fundamental analysis is often used in the share market to assess potential future growth, as well as earnings reports, cash flows and balance sheets of a company, and its overall health. To make the process easier for you, we have built-in Morningstar equity reports and a Reuters news feed in the News and Analysis section of the platform.

When browsing our product library for shares or ETFs, you can open a Morningstar equity research report, which gives an overview of the company’s fundamentals​ for analysis. You can access this report by either right-clicking on the share on the product library list or opening it directly from the instrument’s price chart. Below is an example of a Morningstar report for Canadian gold-mining company, Newmont Corporation.

These fundamental reports highlight key company statistics, such as market capitalisation, dividend yield, revenue, earnings per share and more. They also suggest whether a particular share is under or over-valued in the stock market, which can help you to make appropriate trading decisions, based on your strategy and goals.

You can also use the instrument’s chart to open a Reuters news feed. This will bring up any recent news that is relevant to the share (or commodity, currency pair, index or treasury) that you are looking at. For example, when opening a Reuters feed from the Newmont price chart, this shows relevant news and headlines related to the gold or mining industries.

Read our article on how to trade the news​ using our fundamental platform tools.

4. Platform tips video tutorial

In this final section, we explore some more of our unique platform features, including those that are only available with a live account. Watch our trading tips video to explore these in more detail and start trading now.

  • Create watchlists. You can create a trading watchlist based on the instruments that you want to monitor. This often comes in the form of a stock watchlist, although you can also create commodity, index and forex watchlists, or a mix of multiple asset classes. Learn how to create a watchlist on our platform.
  • Set up trading and price alerts. Trading alerts are free and automatic notifications that you can switch on for desktop or mobile, in the form of emails, SMS or push notifications on the app. Read about setting up trading alerts, which include price alerts, trade execution alerts and notifications for upcoming economic events.
  • Access our exclusive trading forum. With a live account, you will have access to our social trading forum. Here, users of the platform can share information about the financial markets, as well as strategies and tips for trading. It is commonly used for copy trading also, as users can share their own chart analyses with others and explain how they may have experienced profit.
  • Analyse market sentiment. Our client sentiment indicator is a useful trading tool that displays user behaviour on our platform. It shows the percentage of clients that are currently going long or short on an asset, which may help or influence your own trading decisions, based on if there is strong market sentiment toward a particular asset. Learn about our client sentiment tool.

Our wide range of charting features and trading tools, both fundamental and technical, can be used on the best spread betting platform in the UK* or our CFD trading platform, depending on which product you decide to trade.

Start trading with CMC Markets

  1. Open an account.
  2. Choose your product between spread betting and CFDs.
  3. Consult our trading guides and platform tutorials.
  4. Keep up to date with market news.
  5. Utilise risk-management tools​ such as stop-loss and take-profit orders.

FAQS

How do I start trading as a beginner?

To start trading at beginner level, consult our article on spread betting for beginners. This will take you through the basics of opening an account and depositing funds. You can also browse our CFD trading courses to find out how the process works in a similar way.

What is the best app to start trading with?

Winner of the Best Mobile/Tablet App award*, our mobile trading app is suitable for both spread betters and CFD traders that are looking to trade on a range of financial markets. It comes with mobile-optimised charting and customisable layouts for your devices. Read more about our advanced trading app.

How can I learn trading?

To learn trading, you should ensure that you are always up to date with financial market news, as well as reading books, articles and general tips from successful traders. You could open a spread betting demo account to practise your learned strategies with virtual funds before committing to the live markets.

How much do you need to start trading?

You can start trading with as much or as little capital as you want, as spread betting and CFDs are leveraged products that only require you to deposit a percentage of the full value trade. However, you could end up losing more than you imagine. Read more about the risks of leveraged trading.

How do I start spread betting?

To start spread betting, you should familiarise yourself with our spreads, margins and other trading costs. Then, our spread betting tutorial explains how to place spread bet orders on our platform using our variety of technical and fundamental trading tools.

*No1 Web-Based Platform, ForexBrokers.com Awards 2020; Best Telephone & Best Email Customer Service, based on highest user satisfaction among spread betters, CFD & FX traders, Investment Trends 2020 UK Leverage Trading Report; Best Platform Features & Best Mobile/Tablet App, Investment Trends 2019 UK Leverage Trading Report.

**Tax treatment depends on individual circumstances and can change or may differ in a jurisdiction other than the UK.

Disclaimer: CMC Markets is an execution-only service provider. The material (whether or not it states any opinions) is for general information purposes only, and does not take into account your personal circumstances or objectives. Nothing in this material is (or should be considered to be) financial, investment or other advice on which reliance should be placed. No opinion given in the material constitutes a recommendation by CMC Markets or the author that any particular investment, security, transaction or investment strategy is suitable for any specific person. The material has not been prepared in accordance with legal requirements designed to promote the independence of investment research. Although we are not specifically prevented from dealing before providing this material, we do not seek to take advantage of the material prior to its dissemination.