Spread bets and CFDs are complex instruments and come with a high risk of losing money rapidly due to leverage. 67% of retail investor accounts lose money when spread betting and/or trading CFDs with this provider. You should consider whether you understand how spread bets, CFDs, OTC options or any of our other products work and whether you can afford to take the high risk of losing your money.

Pivot points

Pivot points are technical trading indicators​ based on a calculation that uses the previous day’s high, low, and closing prices for various financial assets. In trading, pivot points can be used to help judge uptrends and downtrends and identify the best points to enter or exit a trade.

Traders can use the pivot point indicator for a wide range of financial markets​, such as indices, stocks and most commonly, forex trading. This article will discuss pivot point calculations, along with the best strategies and examples for how to trade pivot points.

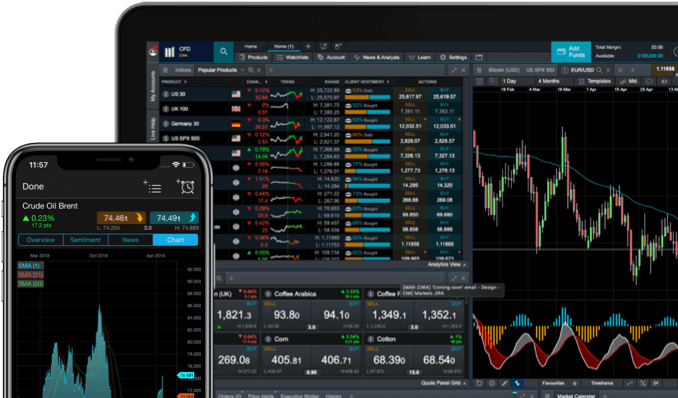
See inside our platform

Get tight spreads, no hidden fees and access to 12,000 instruments.

How pivot points work

While the indicator is often called “Pivot Points” in the plural form, there is only one pivot point in the indicator. It is used to judge whether the current trading session has an upward or downward bias. This can help traders to determine the direction to trade in and provide ideas on where to take trades.

There are several strategies that can be used with pivot points, since the indicator is highlighting potentially important price areas for the day. By monitoring pivot points for certain signals, pivot points can be used to generate a strategy composed of an entry, stop-loss, and profit target.

What are pivot points in technical analysis?

Pivot points are a form of technical analysis​​ that is calculated using price levels from the prior period. The indicator levels are then used to help make trading decisions in the current session. It highlights whether the day’s trend is on the upside or downside and also where support and resistance​ levels may develop. The indicator includes one pivot point that sets the upward or downward bias for the day, as well as three support and three resistance levels.

Pivot point calculator

When using our online trading platform, Next Generation, it automatically provides pivot points to price charts with the click of a button, so you will not need to calculate the indicator levels yourself. However, it is still useful to have knowledge of the pivot point formula, which is the following:

Pivot point (P) = (high + low + close)* / 3

Support 1 (S1) = (P X 2) — (high)

Support 2 (S2) = P — (high — low)

Support 3 = P (S3) — (R2 — S2)

Resistance 1 (R1) = (P x 2) — low

Resistance 2 (R2) = P + (high — low)

Resistance 3 (R3) = P — (S2 + R2)

*Please note that high, low, and close represent the high, low and closing prices from the previous trading session.

Best pivot point trading strategies

Pivot points have a few basic functions that can be incorporated into different trading strategies. The indicator is primarily used for day trading in various markets, such as futures, commodities, stocks, forex, and indices, and it also provides basic guidelines on whether the day is bullish or bearish​.

The basic functions of the pivot point indicator are the following:

  • If the price is above the pivot point, the bias is to the upside for the current session’s trend. If the price is below, the bias is to the downside.
  • If the price falls through one of the levels on the indicator, the next level lower can be used as a profit target or estimate of where the price may go next. If the price rises through one of the levels, the next level higher can be used as a profit target or estimate of where the price may be heading.
  • The indicator levels may act as possible trade areas, as the price moves through or bounces off them. Ideally, trades could be opened in the overall trending direction for that day.
Join a trading community committed to your success

Pivot point candlesticks strategy

Pivot points are most commonly displayed on candlestick charts​. The candlestick patterns that form near pivot point indicator levels can provide more precise entry points than solely relying on the levels themselves.

Let’s use the gold chart below as an example. If the price is above the pivot point, there is most likely an uptrend. The price moves to R1, then forms a triangle pattern. Instead of simply buying at R1, the trader could wait for the price to break out above the top of the triangle, other candlestick or chart pattern. Whichever level the price is near, traders could wait for the price to confirm the direction that it is trying to move in.

If you look for chart patterns to form near these levels, then it may be possible to trade breakouts from the patterns. Since the levels may cause the price to reverse or continue with its current trend, the breakout will help to determine the outcome.

The five-minute gold chart below shows the price hovering around the pivot point early in the day. The price then steeply falls, dropping through S1. It forms a rectangle twice (a small sideways range) near S2. The price broke out of the range to the downside both times. These downside breakouts could have been used to enter a short trade. A stop-loss​ has been placed approximately 0.1% above the top of the rectangle being used.

Another option is to use a trailing stop-loss​ where S3 is a possible target. A 15-period simple moving average​ (SMA) has been added to the chart. When the price crosses back above the SMA, traders could consider exiting the trade.

As for candlestick patterns, engulfing patterns are useful. An engulfing pattern is a large up or down candle, followed by an even larger candle of the opposite colour and direction. This second candle is called the engulfing candle.

You could enter in the direction of the engulfing candle when it is near a pivot point. If the engulfing candle is down (it closes below the prior open candle), a stop-loss can be placed just above it. If the engulfing candle is up (it closes above the prior open candle), a stop-loss can be placed just below it, using the same profit target or take profit levels as discussed above.

We can interpret from the same chart that the engulfing patterns provided a few entries near S2. The first is a long, taken after a large up candle engulfs the prior down candle. The stop-loss is at the bottom of the small rectangle and it is quickly hit as the price continues to decline. Losing trades happen, although the chances of this occurring can be reduced by only taking trades in an overall downward trend direction.

The below chart signals a winning trade. There are two bearish engulfing patterns with stop-losses near the top of the small pink boxes. As these were not hit, the price continues to lower.

Pivot points intraday trading

Pivot points are most commonly used by intraday traders in the UK​, where some may use a one, three, five or even 15-minute or hourly chart. Our online trading platform offers chart timeframes under one-minute, such as one or five-second charts.

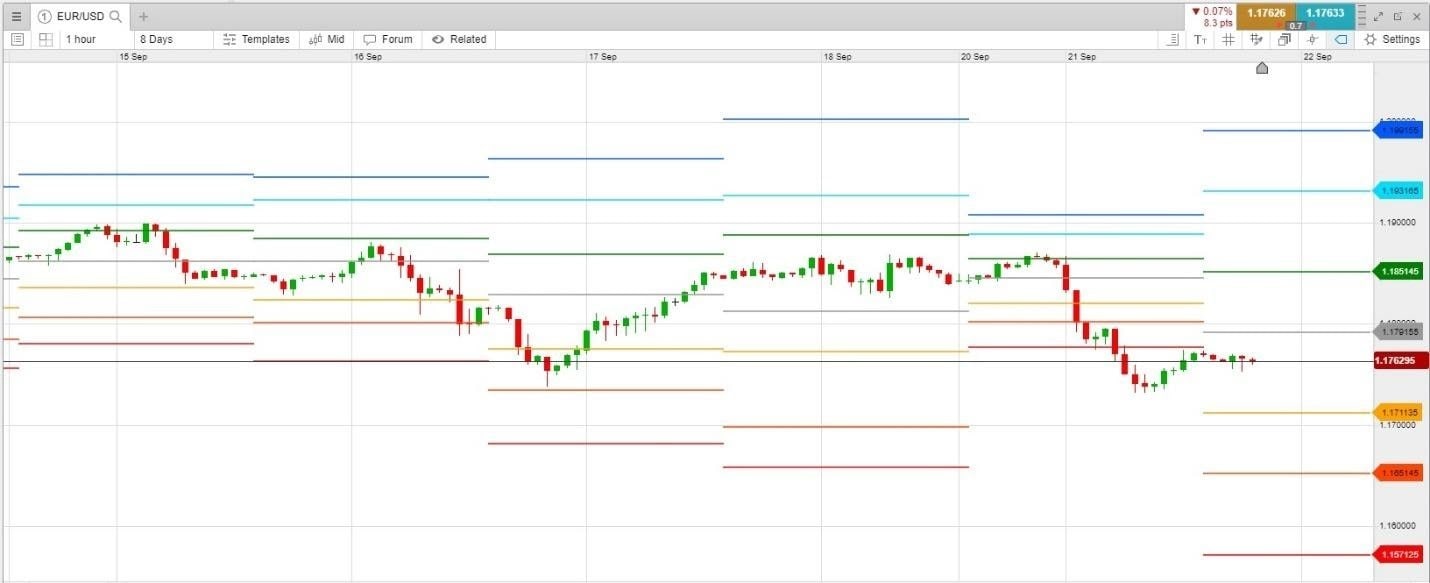
Regardless of the timeframe used, the pivot levels stay the same as they are based on a mathematical formula for the prior day’s high, low and close. Chart timeframes only show price action​ detail occurring around the pivot point indicator levels.

For example, here is an hourly chart of the EUR/USD currency pair. The grey line in the middle represents the pivot point, with the S1, S2, and S3 below and the R1, R2, and R3 above. Because an hourly chart is used, the current session is visible, plus five other prior sessions.

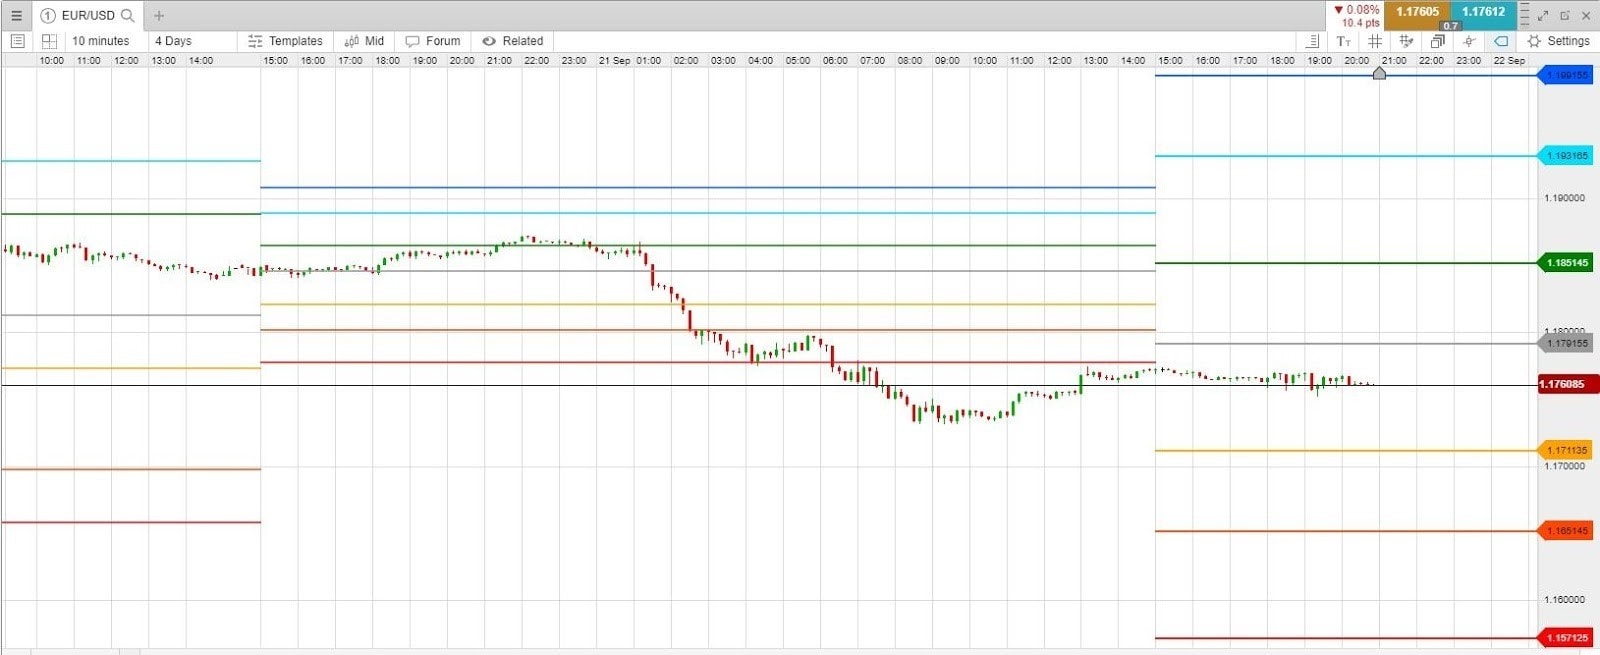
Dropping down to a 10-minute chart below, more detail is visible in the price action. Only the current and prior sessions are now visible, but we see some of the smaller price movements that occurred during each day.

A timeframe of 15 minutes or less is typically required to carry out a candlestick strategy, as discussed above. A smaller timeframe, such as smaller than a one-minute chart, may provide more detail than required, whereas a higher time frame of above 15 minutes will not typically provide enough information to generate the engulfing or chart patterns that are needed to generate trades.

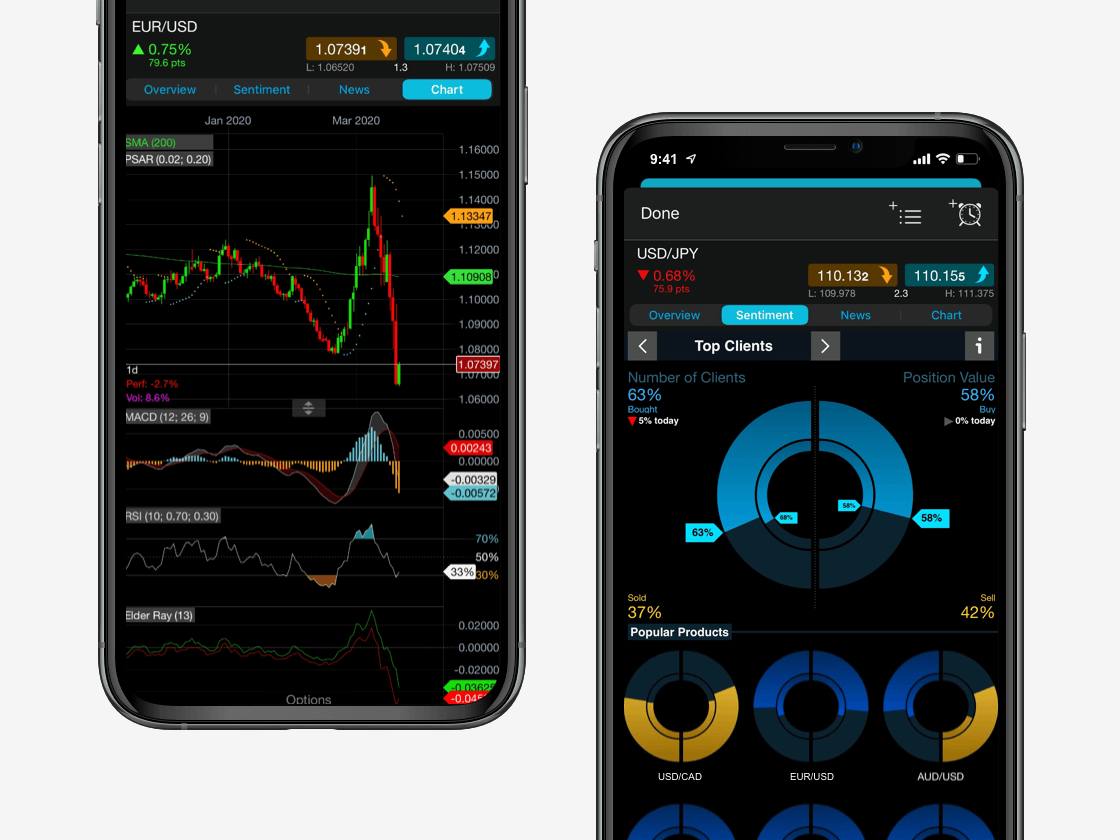
Powerful trading on the go

Seamlessly open and close trades, track your progress and set up alerts

Pivot points in forex

The forex market is open 24 hours a day during the week. The official forex trading​ day starts and ends at 5PM Eastern Standard Time (EST) at the end of the US trading session. This is the daily close, yet most retail day traders have finished trading before that time, and the last couple of hours of the US session is typically quiet with not a lot of price fluctuations.

Forex pivot points are calculated based on the high and low for the entire 24-hour period, and the close at the end of the US session is used in most pivot point calculators. While the pivot point indicator can provide key areas to watch over the following 24-hour period, the levels are not always relevant to someone who is only trading during the London or US session. They are only trading a small portion of the day, yet using an indicator based on 24 hours of price action.

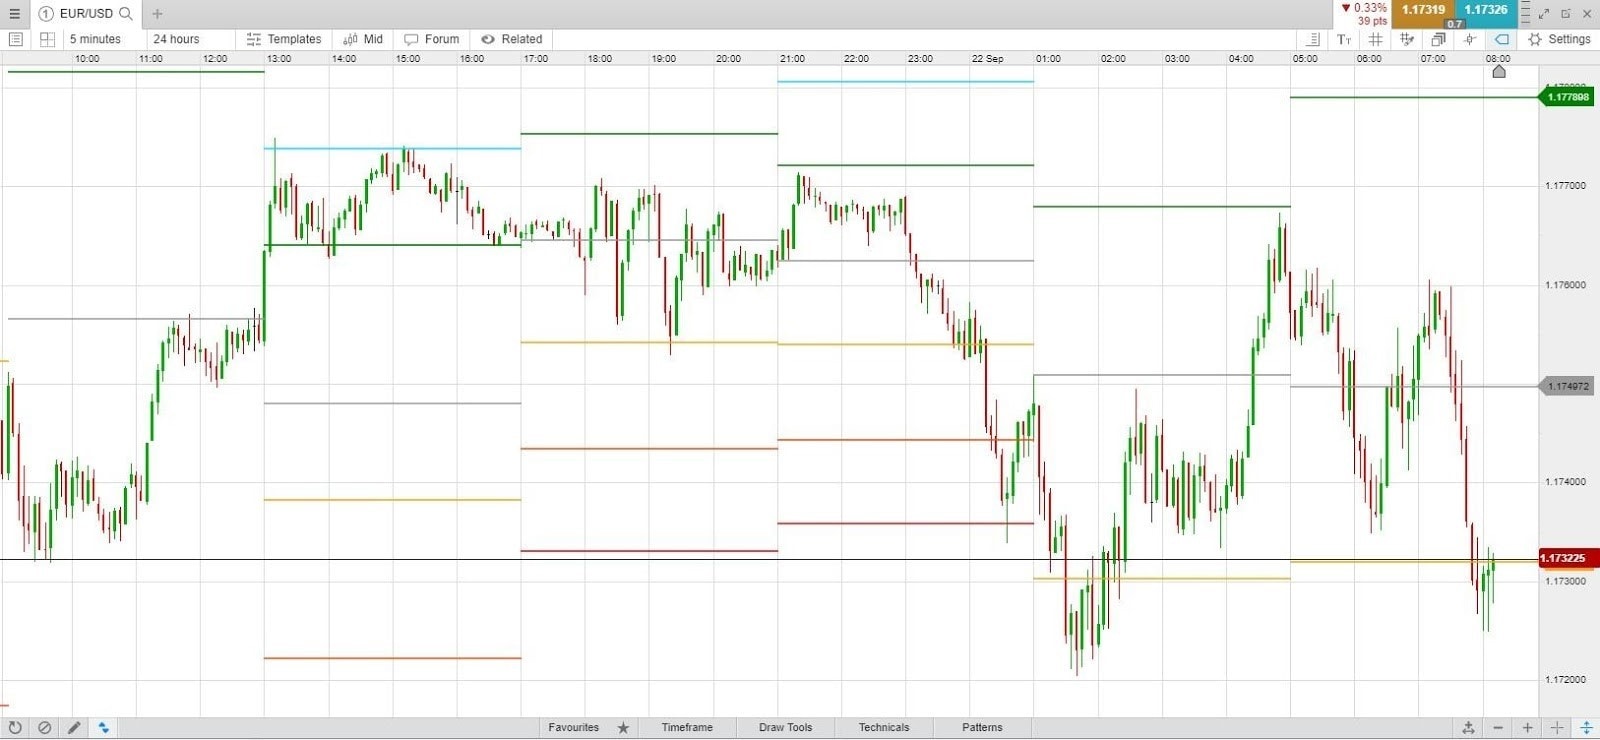
Pivot points can also be applied based on four-hour or hourly high, low, and closing prices (or any other timeframe), as opposed to daily figures. The chart below shows this for EUR/USD trading. On our platform, you can add pivot points to your price chart and change the timeframe of the indicator. This will provide more potential areas to watch during the 24-hour period. Over this 24-hour period, six sets of pivot points are generated. This may provide more potential trades or greater insight for forex day traders, in particular.

FTSE pivot points

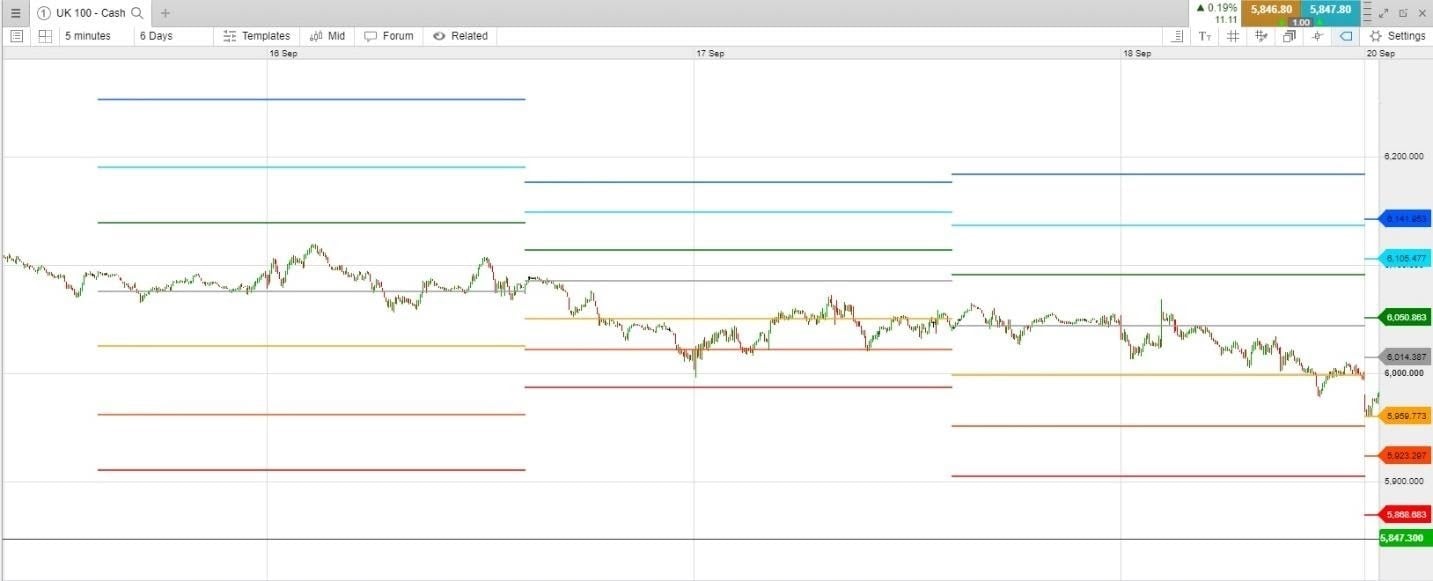
Another market that the pivot point indicator can be applied to is stock indices​, such as the FTSE 100, which represents a benchmark for the largest companies by market capitalisation in the UK. The graph below shows a five-minute FTSE chart with pivot points applied, based on the daily high, low and close prices.

Using index futures (forward​) contracts, you can consider trading these indices virtually 24-hours a day, even though the underlying stocks do not. This creates the possibility of using high, low, and close prices for smaller timeframes to generate more trade levels throughout the day.

The following chart shows the same three days as the five-minute chart, but instead, pivot points are applied based on four-hour high, low, and closing prices. Traders should look for chart pattern breakouts or engulfing patterns near the pivot point lines.

Pivot point system

To start trading with pivot points, you can find the indicator on our award-winning trading platform​, Next Generation. You should consider your trading strategy for entering trades, setting stop-loss orders and taking profit.

It is possible to adjust pivot point settings, such as the pivot interval (timeframe used for the high, low, and close), or you can toggle whether you see historical pivot points or not. You can also take advantage of our drawing tools that are located along the bottom of the platform. These include trendlines, rectangles, triangles, arrows, and text notes to add to your chart in order to display your data as clearly as possible.

Read more about our charting features​ here.

Once the pivot point indicator is applied to a price chart, you can look for trading opportunities. These levels will often act as support or resistance, so chart pattern breakouts or engulfing patterns will often occur near these levels. These are known as entry signals. You could consider placing a stop-loss just outside the opposite of the pattern, or for a target, use the next pivot level or a trailing stop-loss, such as a moving average.

How to trade pivot points

Pivot points are easily applied to a chart and are based on the high, low, and close prices of a particular timeframe, often in a one-day period. To create a pivot point trading system, a trader will need the indicator, a market or trading instrument of their choice and a trading strategy. This includes an entry method, as well as a stop-loss and profit target.
The drawback of pivot points is that the daily pivot levels may not always be relevant to a day trader who is only trading for a short time during the day. Hourly high, low and close prices can be used to generate more pivot points, yet these are arbitrary timeframes and may not always be useful.

Therefore, it is important to wait for a price action signal before trading off a pivot point. The engulfing patterns and chart pattern breakouts provide one other piece of evidence that the price is moving in a certain trend​ direction.

Join a trading community committed to your success

Disclaimer: CMC Markets is an execution-only service provider. The material (whether or not it states any opinions) is for general information purposes only, and does not take into account your personal circumstances or objectives. Nothing in this material is (or should be considered to be) financial, investment or other advice on which reliance should be placed. No opinion given in the material constitutes a recommendation by CMC Markets or the author that any particular investment, security, transaction or investment strategy is suitable for any specific person. The material has not been prepared in accordance with legal requirements designed to promote the independence of investment research. Although we are not specifically prevented from dealing before providing this material, we do not seek to take advantage of the material prior to its dissemination.

Join over 275,000 other committed traders

1

Apply for a live account

Complete our straightforward application form and verify your account

2

Fund your account

Deposit easily via debit card, bank transfer or PayPal

3

Find and trade

One touch, instant trading available on 12,000 instruments