
How to pick stocks: 13 different strategies explained
The investment landscape is dominated by habitual winners, including the likes of Warren Buffett, who will pick stocks that have the best chance of gaining value in the long-term. But there are many different approaches for how to pick stocks for an investment portfolio or short-term trading.
Deciding which stocks to pick can be determined by individual factors unique to the person trading or investing, such as their level of experience or risk tolerance. These factors are what helps to discern the investment criteria for a stock picking strategy. This guide examines 13 strategies to help you pick your own stocks. Sign up for a trading account to start potentially profiting from the different strategies in this guide..
Why pick individual stocks?
Picking an individual stock can yield excellent gains if the stock increases in value. However, any individual stock has a relatively high chance of losing value over the long term. It is very difficult to try and predict which stocks will increase in value in the future.
Picking one stock is like backing one horse to win a race. You may win big if you get it right, but your chances of winning something could increase by backing several horses or going ‘each way’ – where you cover more ground. For this reason, many investors prefer to diversify their portfolio or trade on a mutual fund or exchange-traded fund to spread their bets. You could also trade on baskets of stocks (such as our share baskets) through derivative products such as spread bets and CFDs, which helps to offset the risk of one poor performer.
Things to consider before you start picking stocks
Decide your trading goals and timeframe
You might want to trade over the short-term with stocks that you think will increase in value quickly and allow you to cash out for profit. Meanwhile, a medium-term or long-term time horizon could be taken with stocks you are content to hold on to, such as dividend stocks, for example.
An investment timeframe will directly impact your portfolio mix. Income-focused stocks are typified by a solid cash flow and high dividend yields. Growth stocks tend to be companies that may not be profit-generating but whose sales are increasing quickly. Value stocks are generally well-established companies that generate consistent profits and have a secure position in the market.
Decide how much you want to risk
There are no guarantees when investing or trading. Stock prices can fall dramatically in value but can also spike higher and continue their upwards trend for years.
Therefore, decide carefully how much capital you are prepared to risk. The proportion of the wealth you are investing in should also match your strategy. Growth stocks can provide returns but can also be volatile, which increases a portfolio’s risk exposure.
Investing long-term is less risky than investing short-term because long-term increases in the broader stock market tend to outweigh short-term falls. Managing your risk profile is central to establishing an effective stock picking strategy.
How to pick stocks
Find companies you understand
CEO of Berkshire Hathaway Warren Buffett’s words of wisdom are to “never invest in a business you cannot understand”. There are several big advantages to sticking to companies or industries you know well.
Firstly, your knowledge of the business will give you a greater understanding of the opportunities and risks facing it than your competitors. Picking stocks is about reading a company’s prospects better than anyone else. If you lack understanding of a company’s business, you’ll have less of an idea of how positive its prospects are. If you’re going to invest in a company, it’s worthwhile having a basic understanding of how it operates and understanding every aspect of its balance sheet. You can do this by performing company analysis.
Most professional investors spend their careers speculating on a particular set of industries, allowing them to consolidate their knowledge and expertise. By concentrating on a particular area, an investor can get better at predicting the impact of macro and micro changes, such as the release of new technologies.
Pick story stocks/trade the news
Story stocks are shares of companies that are priced based on a popular narrative of potential upside growth. In technology sectors, this can hinge around a company’s potential to discover or invent a ground-breaking new technology.
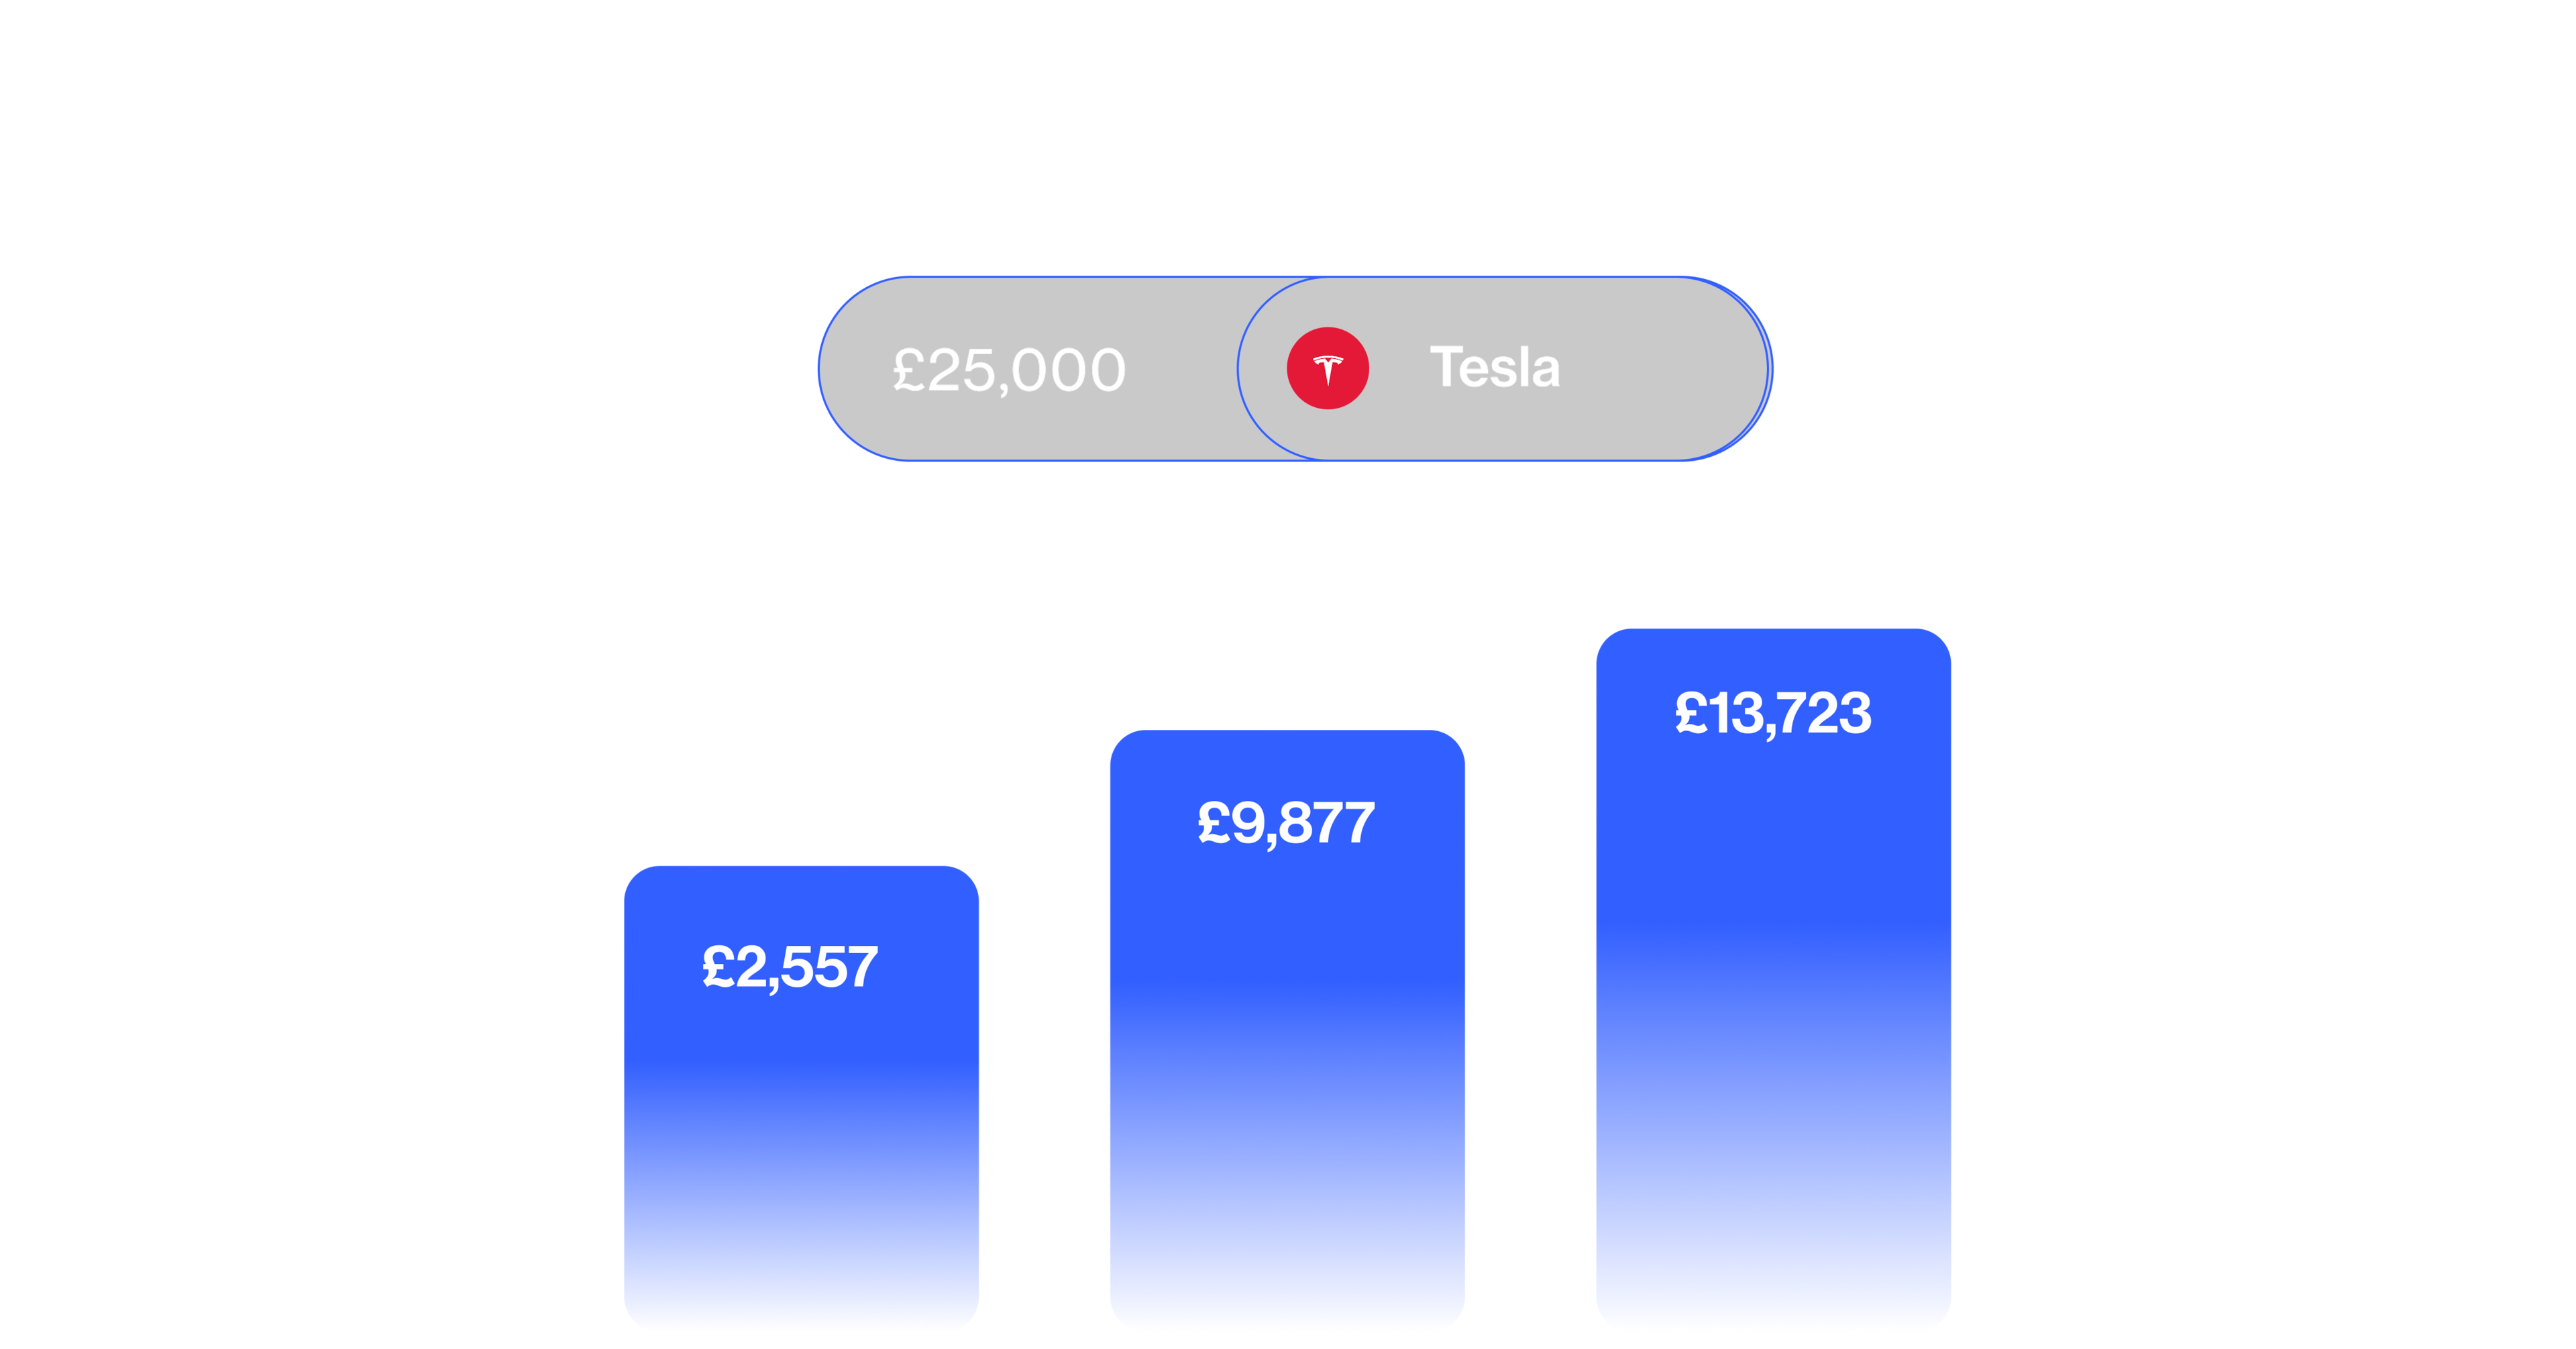
Story stocks, such as Amazon or Tesla, are quite extreme examples of growth stocks. Their profits either do not exist or do not come close to justifying their valuation, and large revenue increases are required to sustain investor optimism. They are consequently volatile but offer investors significant upside in exchange for an increased level of risk.
Trading the news involves keeping a close eye on what’s happening in the world, particularly macroeconomic events (such as changes in interest rates) that impact entire economies. The same news stories might affect various stocks and industries differently, so it is important to build up a good understanding of how different stocks will react to certain events.
Company news announcements are also an important source of information. But while a positive press release, such as an earnings beat, could indicate that a company’s stock might increase, traders need to be quick to take advantage. For example, Virgin Galactic’s share price gained 8% in pre-market trading the day after its first successful test flight but ended the day down 14%, thanks to subsequent news that it was looking to sell shares to raise funds.
Technical analysis
Technical analysis is one of the most used tools for picking stocks for short-term trading. It involves using past price performance to predict future performance through chart patterns and technical indicators. It has three underlying assumptions: that markets (prices) account for all relevant information about a stock; that prices move in trends rather than erratically; and that these trends tend to repeat themselves over time.
Technical indicators can help decide a trader’s entry and exit points. For example, breakout stocks are those that move beyond a certain level of support and resistance, or the upper and lower price limits that a stock has historically stayed within.
Breaking a resistance level will usually prompt investors to buy a stock and increase its price, while falling through a support level will increase pessimism and usually bring a stock’s price further down.
Technical analysis also relies on charting patterns, especially candlestick charts, to provide indications of future price movements based on past trends. For example, a very small candle (i.e., a small difference between the open and closing price) at the bottom of a downward trend is called a ‘morning star’ and is an indicator that a stock’s price decline is potentially about to reverse.
Analyst ratings
Analysts at investment banks and other financial institutions use a combination of technical and fundamental analysis to build up an investment case and price targets for financial instruments, including stocks. These usually consist of a rating, typically a variation of ‘buy’, ‘hold’ or ‘sell’, which give a general indication of whether they think stocks are likely to increase in value over a given period (usually 12 or 18 months). Hold ratings indicate that the analyst believes the stock will perform roughly in line with the market and/or other competitors.
Typically, one or more analysts upgrading their rating of a stock (e.g., from hold to buy) will prompt an increase in its share price, while downgrading has the opposite effect.
Analysts often accompany their ratings with a price target. This is what the analyst considers a fair price for the company’s stock, reflecting its expected future value (usually in 12 months’ time). Again, price target increases usually prompt a share price increase, and vice versa.
Company earnings
Analysts, market commentators and company insiders will often issue projections ahead of upcoming earnings reports. In the weeks building up to an earnings announcement, the bullishness or bearishness of analysts’ expectations will affect a company’s share price. If analysts anticipate a disappointing set of results, for example with earnings falling 5% year-over-year, a share price could take a hit in anticipation.
However, these projections are just estimates and analysts can sometimes get them wrong. Companies are frequently able to spring earnings surprises, either positively or negatively. Should the company’s earnings report reveal that earnings increased 5% year-over-year, it will have beaten analyst expectations and its share price will usually increase.
In fact, the share price could still rise even if earnings fall year-over-year. If the decline is less than analysts forecast because markets will have expected (and priced in) a worse set of results than what materialises.
Share price movements can sometimes happen very quickly after a surprising set of results, so it is important to pay close attention to announcement timings and be prepared to assess earnings reports as soon as they are released.
Trade positioning and sentiment
Some leading and lagging indicators can be used to identify stocks that have been overbought or oversold. If momentum starts slowing in a stock price, this can be a leading indicator that its price movement is about to reverse. For example, a stock whose price has trended upwards for 14 days, but whose pace of increase is slowing, could be running out of buyers and its price may soon fall.
Sentiment indicators can also be used to gauge general market feeling towards securities, including stocks. Bullish sentiment will normally result in increasing prices. Many traders like to use market sentiment to inform contrarian trading strategies — for example taking advantage of bearish sentiment to buy stocks when they are cheap and selling them when bullishness pushes prices up. Trade positioning and sentiment analysis can combine to guide timings of entries and exits.
Positioning and sentiment indicators can be technical or fundamental. For example, the CBOE (Chicago Board Options Exchange) Volatility Index, known as the VIX, is a technical indicator of expected upcoming market volatility for the S&P 500, while a disappointing earnings report would be a fundamental indicator of an upcoming fall in a company’s share price. What is the VIX?
Insider trading
Company insiders tend to know more about a business’ prospects than markets in general and are legally obliged to disclose their trades. Insider trading activity can, therefore, be a strong leading indicator as to a company’s prospects. Indeed, research, such as that by Market Profile Theorem, has shown that insider activity is a reliable indicator of upcoming bullish or bearish sentiment.
Note that following insider trades is unlikely to give you a jump on the market regarding unknown news stories. It is illegal for insiders to trade shares based on news stories that aren’t public knowledge. They are more likely to give an indicator of general business prospects, or the likely impact that an already known news story might have on the company’s performance.
Follow big fund manager positions
Some fund managers develop a reputation as excellent stock pickers, and in these instances, markets can sometimes respond positively when they adopt a long position on a particular stock.
For example, Catherine Wood’s ARK Invest generated excellent returns by investing in high-growth tech stocks which ballooned in value through 2020. Her fintech-focused ARK Fintech Innovation ETF bought 66,100 shares in PayPal on 4 February 2021. Over the next seven sessions (through 12 February), PayPal’s share price gained 18.4%.
It is easier to follow some fund managers closely than others. ARK Invest reports all of its trades at the end of each day. Buffett’s Berkshire Hathaway is more secretive, but like all investment funds, is obliged to release 13F reports of trades to the Securities and Exchange Commission (SEC) on a quarterly basis.
In instances like Buffett’s, it is important to consider that very well-regarded investors will make their investment decisions based on the price of stocks at the time of their purchase. If prices have already risen significantly, it is possible that whatever hypothesis meant they considered them a good purchase at the time may no longer apply.
Find trending or social media stocks
February 2021 saw a notorious wave of ‘meme stock’ trading, which was sparked by hyper commentary from the Reddit forum WallStreetBets. While several of the stocks targeted, like GameStop and AMC Entertainment, some saw their prices crash just as rapidly as they rose, many investors were able to realise large short-term gains by following the early recommendations of the subreddit.
If pursuing this strategy, it is important to remember that hype can be fickle and disappear very quickly. Timing an exit is crucial in this instance.
Fundamental analysis
Fundamental analysis considers qualitative factors, such as macroeconomic and microeconomic factors, to determine a company’s intrinsic or relative valuation.
It consists of three main parts: economic analysis, industry analysis and company analysis. For example, when analysing a company’s financial health, some metrics that could be used are its price/earnings ratio, which divides trailing 12-month earnings per share by the stock price to compare how much profit companies generate compared to its share price.
Some fundamental analysis indicators can focus on metrics like earnings and dividends, which are often more useful for value investing than growth investing. The Benjamin Graham school of value investing, which use fundamental analysis, guides Buffett’s investment strategy.
An industry analysis indicator could be a company’s market share, for example. Meanwhile, economic indicators like GDP, inflation rates and interest rates are also helpful in determining how a company’s value might be impacted in the future.
Use a stock scanner
Stock scanners or stock screeners are trading tools that automatically search markets and identify potential stock picks based on user-selected criteria. These can dramatically reduce the amount of time it takes to identify relevant stocks.
Different stock screeners have different features and capabilities, so it’s important to do your research and select the one that works best for you. We’ve compared eight UK stock screeners that could all serve as a starting point for selecting stocks to trade on. Some of these allow searches to be run for free, while others require a subscription.
Many stock scanners allow searches to be run using a combination of fundamental and technical indicators.
Find stocks with rising volume and price
A stock with rising volume may indicate that a buying trend might be gathering momentum. If a stock’s price and volume are increasing at the same time, it may mean that positive market sentiment is gathering pace and driving the stock upwards.
The opposite is also true. Decreasing volumes amid an increasing stock price may indicate an upcoming reversal. Additionally, if volumes are increasing as price falls, then prices could be set to fall further. However, if a falling price is accompanied by decreasing volumes, then it could be about to bottom out and gain in price.
Stock signals
It is possible to set triggers or alerts for action, either buying or selling stocks, based on fundamental or technical analysis. These can act as a good prompt to take advantage of trading opportunities. You can set these up in our trading platform, so read more about trading alerts.
We also offer a built-in pattern recognition scanner, which looks for chart patterns of interest, such as wedges and double bottoms. Traders can use this to receive alerts for stocks that are exhibiting these bullish or bearish patterns.
When trading on stocks on our Next Generation platform, there are no currency conversion fees because when you trade stocks via spread bets or CFDs, you never actually own the underlying asset. Instead, you are using leverage to speculate on its price movements, potentially netting you magnified gains (or losses) when compared with just buying the stock outright. Learn about derivative trading.
To find out what the most popular stocks are today, login to our platform and open the product library. There is a topical watchlist called ‘Popular Products’ which is updated daily with the most traded products for your region over the last seven days. You can filter this by ‘Type’ by selecting ‘Shares’. Similarly, we offer a ‘Hot Products’ watchlist, which contains stocks whose recent trade volume has increased significantly versus a monthly average.


Ready to get started?
*No1 Web-Based Platform, ForexBrokers.com Awards 2020; Best Telephone & Best Email Customer Service, based on highest user satisfaction among spread betters, CFD & FX traders, Investment Trends 2020 UK Leverage Trading Report; Best Platform Features & Best Mobile/Tablet App, Investment Trends 2019 UK Leverage Trading Report.
Disclaimer: CMC Markets is an execution-only service provider. The material (whether or not it states any opinions) is for general information purposes only, and does not take into account your personal circumstances or objectives. Nothing in this material is (or should be considered to be) financial, investment or other advice on which reliance should be placed. No opinion given in the material constitutes a recommendation by CMC Markets or the author that any particular investment, security, transaction or investment strategy is suitable for any specific person. The material has not been prepared in accordance with legal requirements designed to promote the independence of investment research. Although we are not specifically prevented from dealing before providing this material, we do not seek to take advantage of the material prior to its dissemination.