After the US consumer price index (CPI) rose 7.7% in the year to October, easing from September’s 8.2% increase, US stock indices followed the bullish scenario we described in our 8 November article.
Indices including the S&P 500 and the Dow experienced something akin to the traditional end-of-year rally, but we think the downward trend may resume sooner than most market participants expect – perhaps with the Federal Reserve’s interest rate announcement on Wednesday.
In this article, we show how some bearish scenarios might play out for the S&P 500, Nasdaq 100 and Dow 30 indices. Note that we treat the decline from the year-ago highs as the bearish counterpart to the decade-long bull run that followed the 2008 financial crisis. The structure down from the high should be corrective based on Elliott Wave theory, and an ideal initial support target would correspond to a Fibonacci 38.2% retracement of that long climb in each of the markets we cover here. Of our three indices, the Nasdaq has had the roughest time of it and has already tested the retracement level, although we think it could go even lower.
Our scenarios are based on the expectation that the correction off the high will consist of three segments, labelled in the charts below as [a]-[b]-[c]. In this methodology, third waves and C waves are typically the strongest moves on any time frame, and Elliott Wave traders prioritise finding those opportunities. However, there's some ambiguity in both the Nasdaq and the S&P regarding where the middle segment [b] ends and downward wave [c] starts.
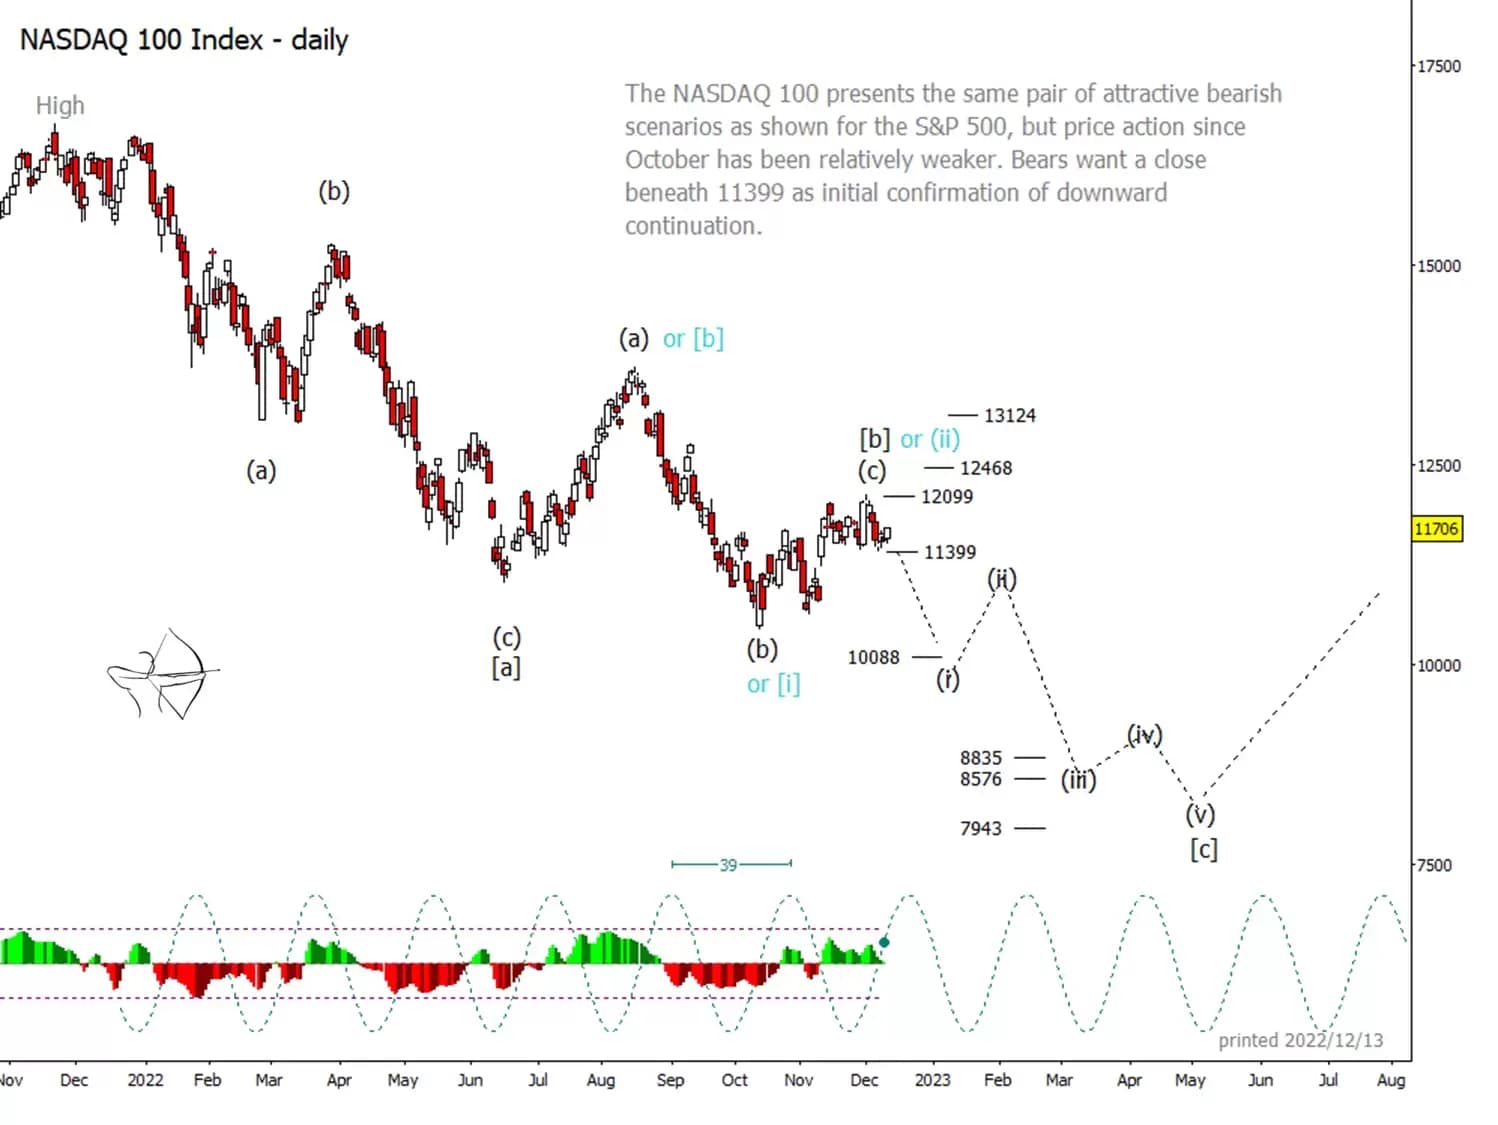
We favour treating last week's high as the culmination of wave [b], which portends a five-wave move down from the current area, but our alternative scenario (shown below with blue labels) has wave [c] beginning at the August high. Price action during the next few weeks might provide clues about which scenario is unfolding, but a similar trading strategy could apply to either scenario.
Tech-heavy Nasdaq could be in for steep descent
The side-by-side charts for the Nasdaq and the S&P make it easier to see how the Nasdaq has been primed to fall earlier and harder than the S&P. At the start of 2022, when the S&P hit a record high, the Nasdaq printed an anaemic lower high. The Nasdaq’s recent rally has also been relatively weaker than that of the S&P.
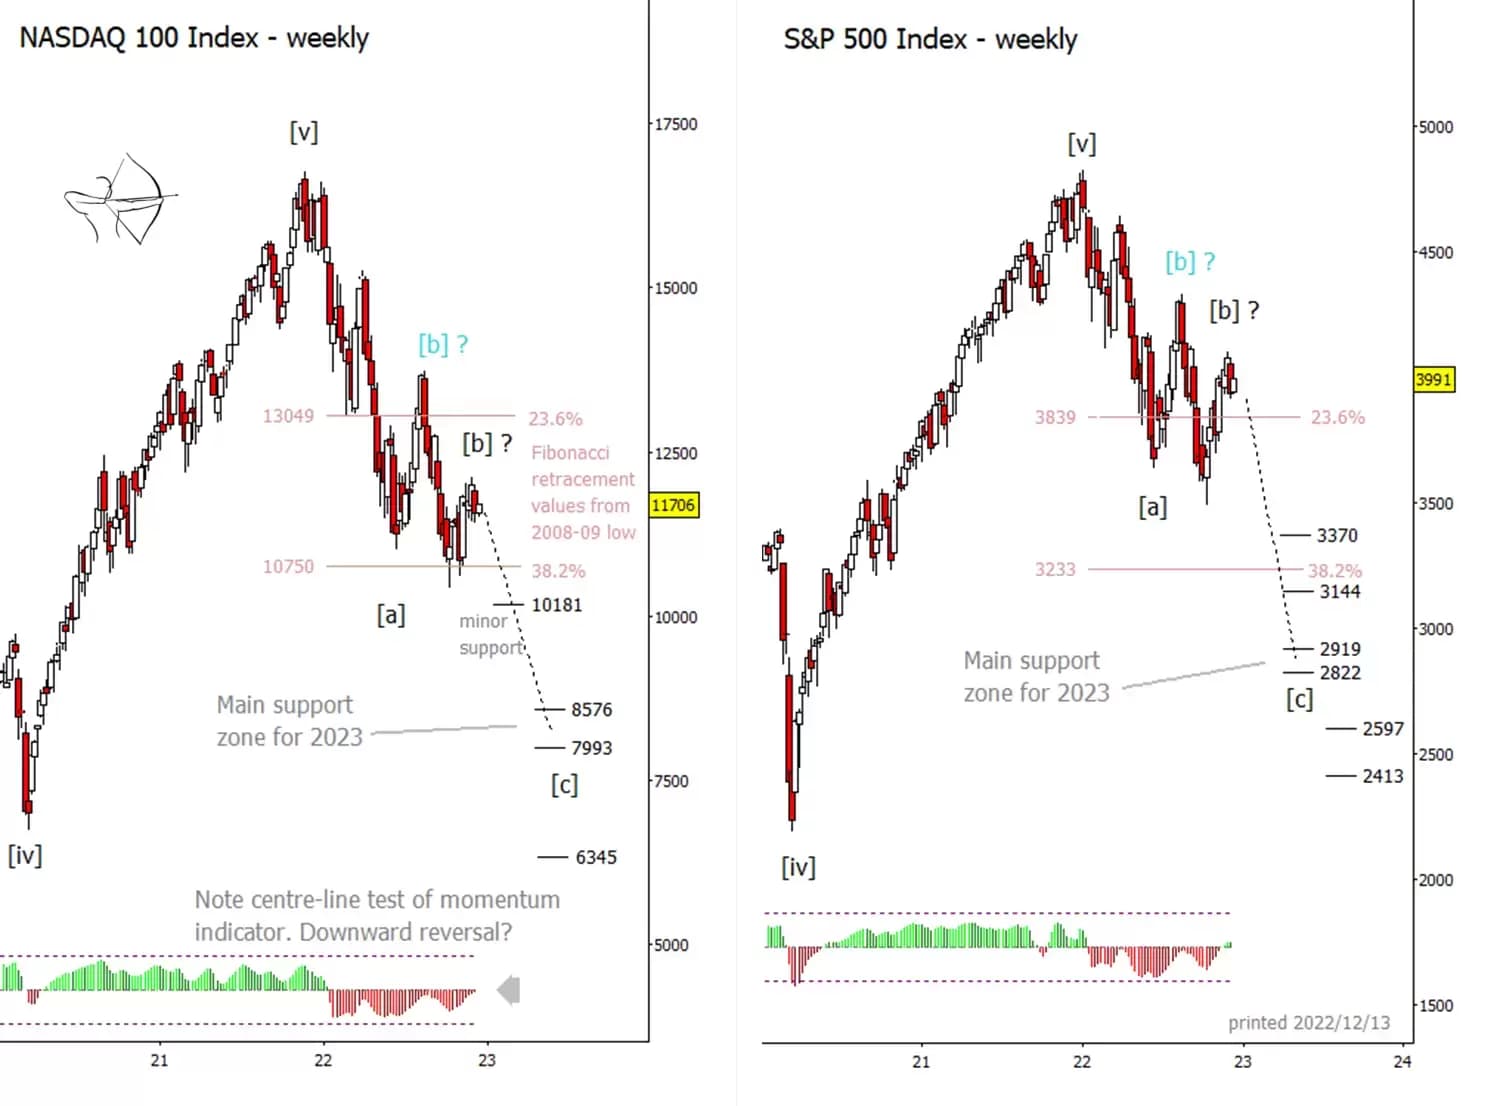
Even though the Nasdaq had a downward head start, we expect both the Nasdaq and the S&P to produce declines of similar magnitude going forward. A drop from the present areas to the upper range of our main support zones for 2023 would represent an approximately 27% reduction from current price levels in both indices.
On a weekly time frame, Nasdaq traders might see some brief support near 10,181 before that level breaks. It's possible that this level could become resistance when tested from below. The main target for mid-2023 waits in the area between 8,576, as labelled on the chart below and 7,993.
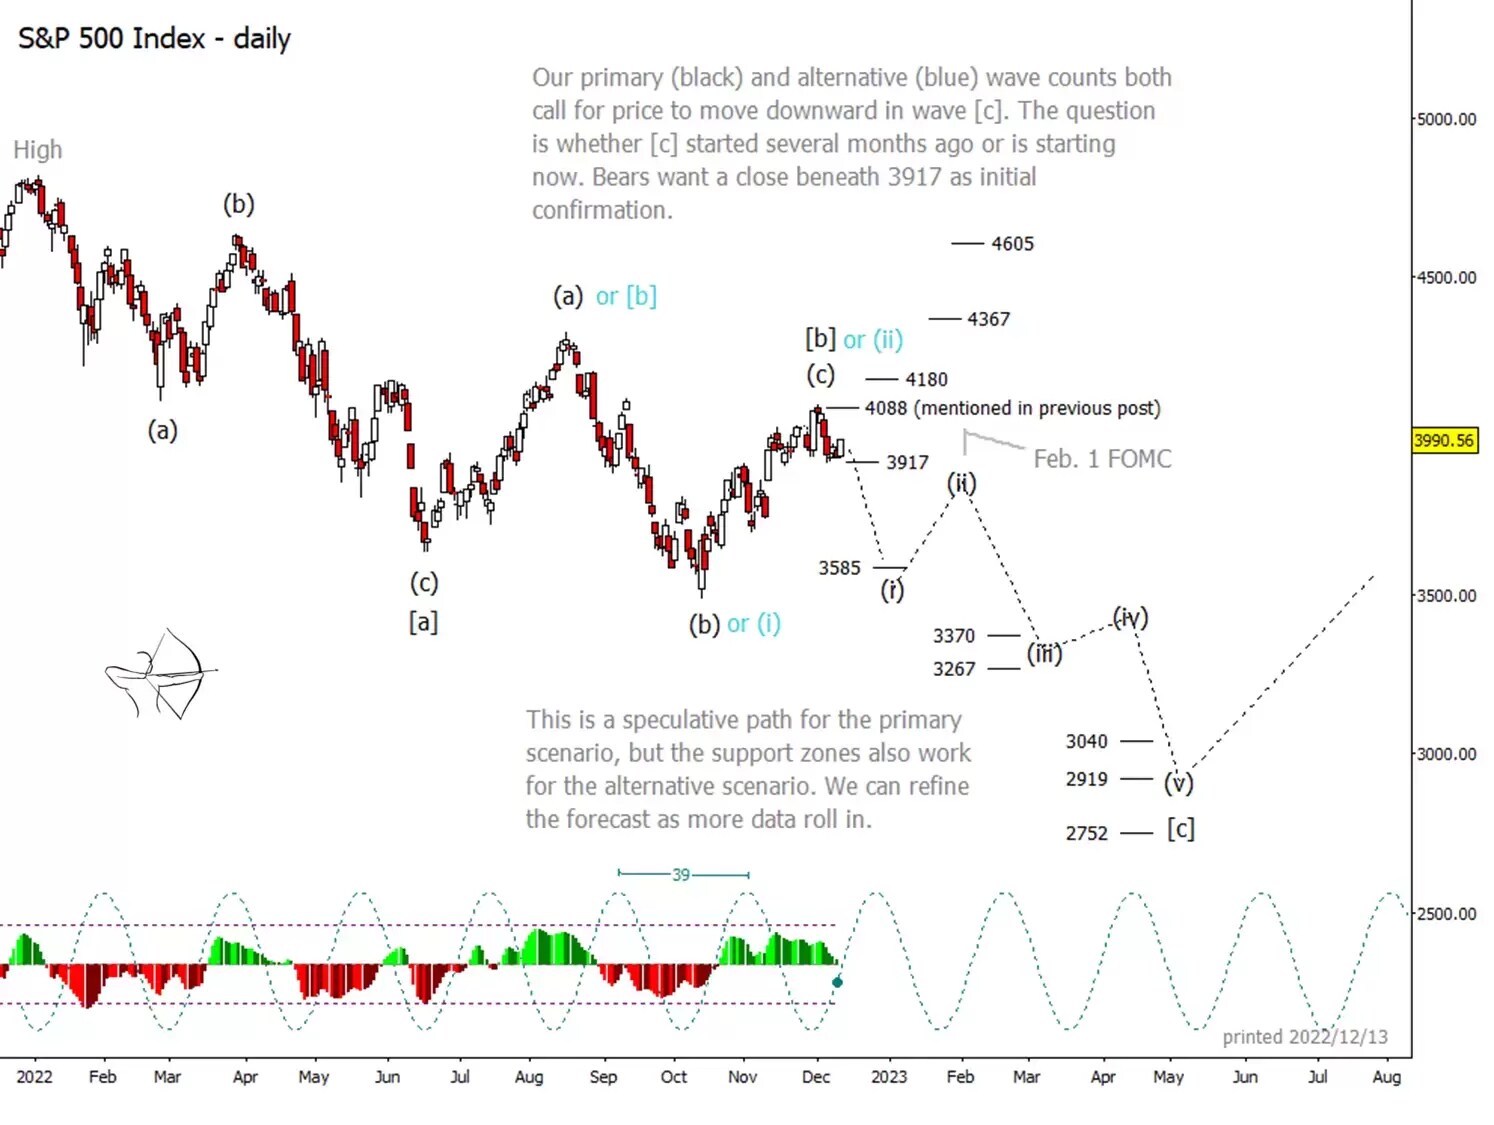
For the S&P, 3,370 and 3,144 might provide initial support before these levels fail and become resistance. The main target zone for next year sits between 2,919 and 2,822.
Although the markets took our less favoured bullish alternative path after last month's CPI, they didn't show much enthusiasm. The S&P was able to reach just the first of the main resistance levels we identified at 4,088, as shown on the chart below.
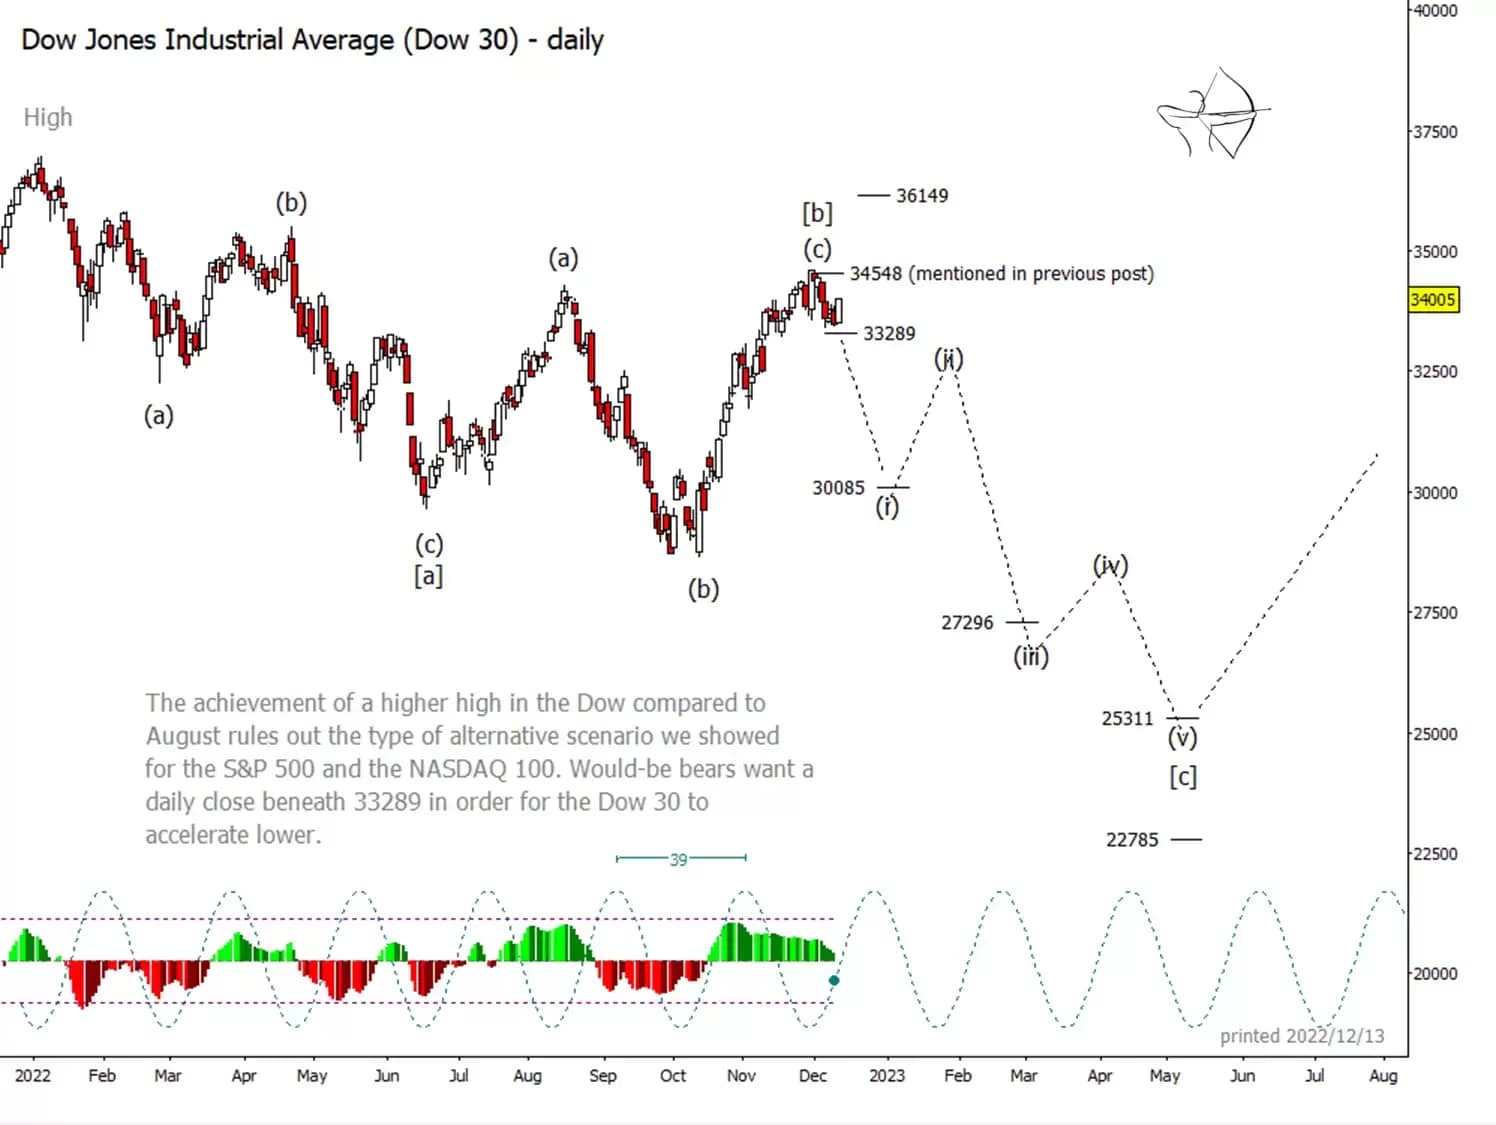
Meanwhile, the Dow was similarly rejected at 34,548, as marked on the chart below.
Key levels to watch
For traders working on daily or weekly time frames, initial confirmation of bearish signals would come with a failure of 3,917 in the S&P, 11,399 in the Nasdaq, and 33,289 in the Dow. The simplest way to define failure of any of those areas would be for the market to produce a daily close below those levels. The most successful Elliott Wave traders don't try to catch the exact tops or bottoms of moves, but instead wait for a sufficient amount of evidence to indicate that a given scenario appears to be working.
Our primary scenario has downward wave [c] starting this month in all three indices. We also note that the same 39-day cycle can be detected in each index. We have used this cycle as a guide to estimate when the major turns might happen during the expected five-wave decline from the current area. Furthermore, we have marked the 1 February Federal Open Market Committee (FOMC) announcement on the S&P chart, above, as a date that might produce one of the turns.
It’s worth noting that our forecast for price lows in each index in 2023 puts the main support zones above the Covid lows of March 2020. From an Elliott Wave perspective, it would be more satisfying to see the 2020 lows tested again. However, the markets might hold that event in reserve until later this decade. In any case, after the near-term downward moves that we are forecasting, a substantial years-long rally could start in 2023.
For more technical analysis from Trading On The Mark, follow them on Twitter. Trading On The Mark's views and findings are their own, and should not be relied upon as the basis of a trading or investment decision. Pricing is indicative. Past performance is not a reliable indicator of future results.
Disclaimer: CMC Markets is an execution-only service provider. The material (whether or not it states any opinions) is for general information purposes only, and does not take into account your personal circumstances or objectives. Nothing in this material is (or should be considered to be) financial, investment or other advice on which reliance should be placed. No opinion given in the material constitutes a recommendation by CMC Markets or the author that any particular investment, security, transaction or investment strategy is suitable for any specific person. The material has not been prepared in accordance with legal requirements designed to promote the independence of investment research. Although we are not specifically prevented from dealing before providing this material, we do not seek to take advantage of the material prior to its dissemination.


