Both the Dow Jones and the S&P 500 fell into the support areas that we identified last week ahead of the US Federal Reserve's interest rate announcement. While the declines met our initial expectations, subsequent price action has caused us to revise our primary and alternative forecasts. This week's consumer price index (CPI) reading could trigger a rapid move out of the zone that has contained the market in recent days. Our data indicate that the escape path might be downward. Once the direction is set, the next move could extend to mid-December.
Below, the daily chart for the S&P 500 illustrates our two leading Elliott Wave scenarios. The graph highlights the dilemma that wave counters often face. The move up from the 13 October wave (b) low can be counted as five small waves, which meets the formal criteria for upward wave (c) to be complete. We have diagrammed that near-term bearish scenario in red on the chart below.
Alternatively, the same five-wave structure could represent merely the first segment of a larger five-wave pattern that would also serve the role of wave (c). We show that near-term bullish scenario in green. However, a rally from the CPI announcement probably wouldn't last much longer than a month. The pending interest rate announcement on 14 December could cap any enthusiasm that might ensue this week.

S&P 500 misses out on promotion after US jobs report
It's notable that last Friday's favourable non-farm payroll print – the US economy added 261,000 jobs in October, beating economists’ forecast for 200,000 new positions – did not provide a springboard for the S&P 500 to climb above resistance at 3,917 (see above chart).
That resistance level represents a Fibonacci 61.8% ratio of presumed wave (c) to the earlier wave (a), and it's a "sneaky" place for wave (c) to end. Typically C waves are strong enough to move beyond the 61.8% level in relation to their counterpart A waves. The failure of the October-November rally to exceed that level strengthens our confidence in our primary bearish scenario, which considers wave (c) of [b] complete and has price now falling in larger wave [c].
If the index moves downward out of the current area, the next support areas to watch ahead of the Fed’s announcement on 14 December are at 3,397, 3,144 and 2,822. Bears might also identify stretch targets at 2,563 and 2,413, but we expect the market to wait a few more months before attempting to test those lower areas.
Alternatively, if the market rallies in response to the CPI reading, resistance levels could come into play at 4,179, 4,367 and 4,605, which represent more common ratios of wave (c) to wave (a). Less prominent resistance areas to watch in case of a bullish breakout are at 4,088 and 4,566, which are based on retracement measurements from the January high. The alternative path would make for a more conventional bullish end to the year.
Dow trending lower
The Dow daily chart, below, paints a similar picture. However, the Dow’s relatively stronger rally in October and early November has brought the index nearer to a more traditional one-to-one relationship between waves (c) and (a). Identical lengths for the two waves would put resistance at 33,289, which is just above last week's high. The way the Dow is approaching and "noticing" the 1x1 area strengthens our confidence in the bearish scenario.
On the chart below, we show our primary scenario. It takes price out of the recent consolidation zone and moves it into an area with few obvious supports. That suggests the bearish scenario could take the Dow quickly to more important supports at 28,561 and below. Before that happens though, traders should allow for an attempt to make a minor new high so the market can hit that 1x1 level at 33,289.
A bullish reaction to the CPI number could see the index of 30 prominent US companies test the next resistance areas at 34,548 and 36,149. This scenario corresponds to the bullish path we described for the S&P 500, above.

How might the S&P 500 and Dow fare in the near term?
The next two charts show how the indices might behave on an intraday basis in either scenario.
The main retracement resistance areas to watch in the S&P 500 prior to Thursday’s CPI update are 3,830 and 3,866. Our data suggest that price could fall from that zone starting on Thursday or Friday.
Some lower supports appear as a contingency in the very near term at 3,652 and 3,582. Those simply represent deeper retracement levels that could provide a bounce if the index were to fall further before the CPI. We think it's unlikely that they will come into play, but it’s just as well to be prepared.
If our alternative, bullish scenario takes hold, we calculate resistance targets for a holiday-season rally at 3,958, 4,118, 4,233 and 4,378 based on the internal measurements of the move up from October.

As for the Dow, if it pops to a minor new high before Thursday’s CPI announcement, it probably won't exceed the zone between 33,289 and 33,495. Anything higher than that would have us consider moving the holiday rally scenario to the forefront.
Similar to the S&P 500, the Dow has near-term (i.e., prior to Thursday’s CPI update) support just below current levels. These supports are at 31,301 and 30,820. The index already put in a test of the support at 31,692 that we identified last week.
We need to see additional price action before we can identify post-CPI minor support levels in our primary bearish scenario. Major supports shown on the intraday chart below are the same as those presented on the daily chart.

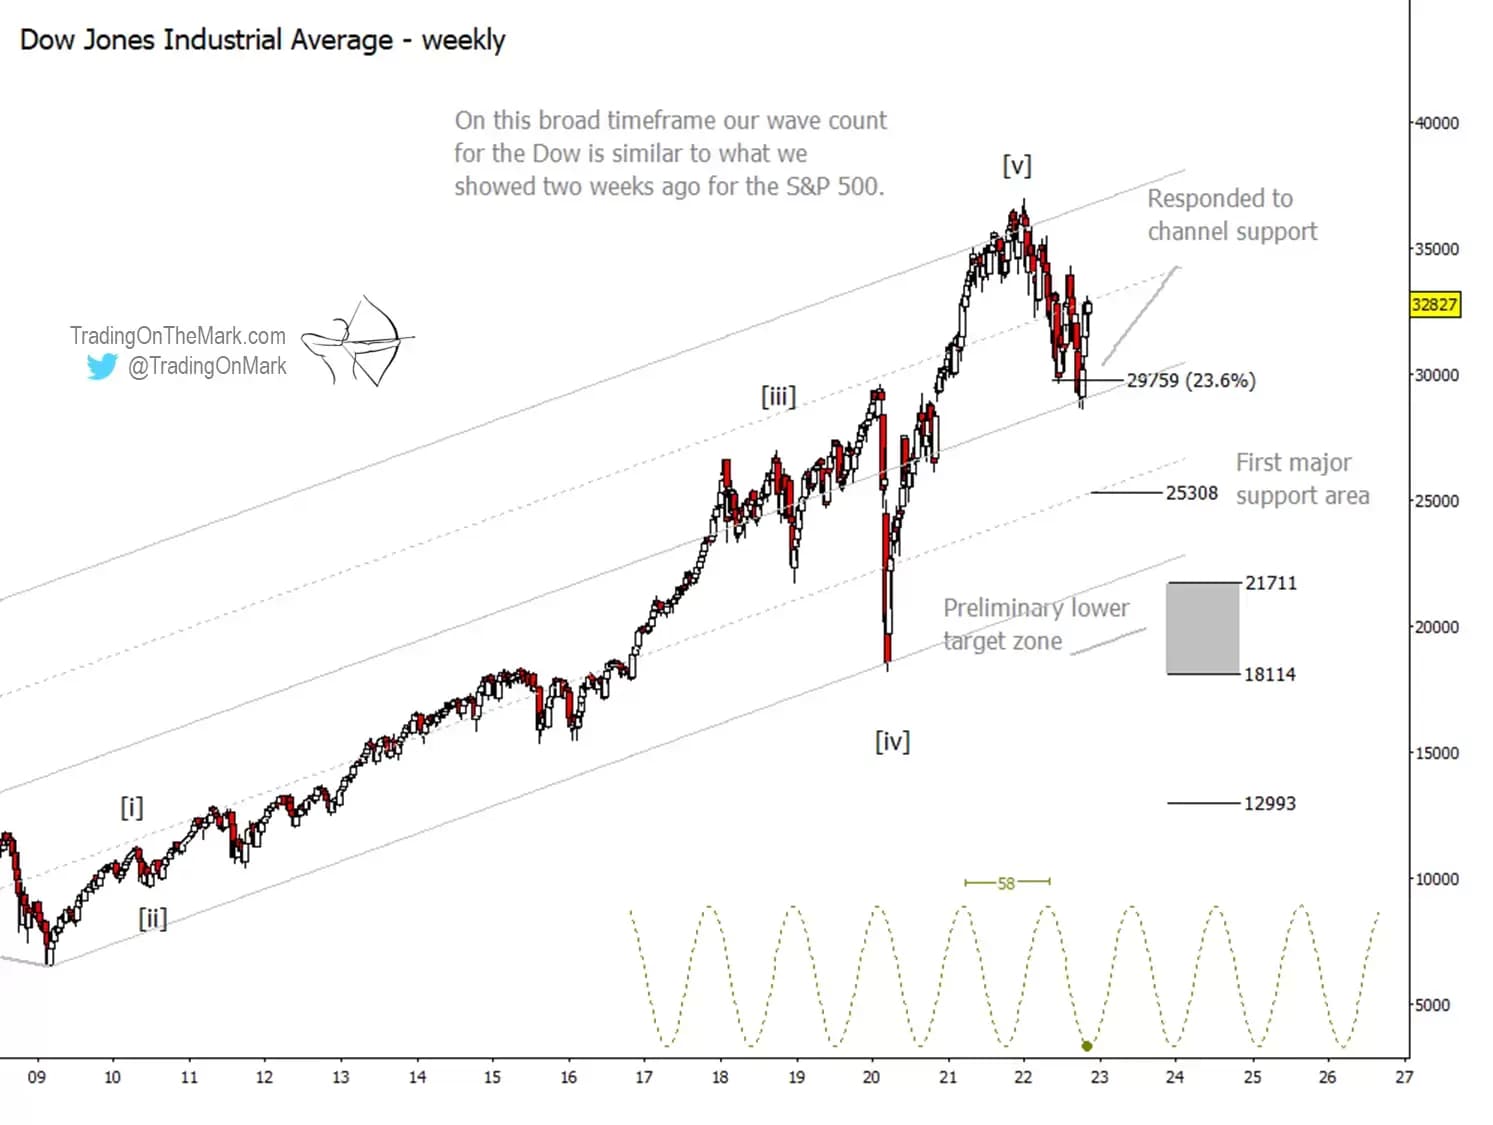
Big-picture chart points to possible dip for the Dow
The compressed, weekly Dow chart below shows our bigger-picture wave count and our rough expectations for the continuing correction. The index found initial support at the Fibonacci 23.6% retracement of the 2009 low to the 2022 high, and it found additional support at the centre line of one of the viable channels that can be made to fit this time window.

The first area to watch for the big correction to resolve is near the 38.2% retracement level at 25,308. However, there are also some attractive targets that are nearer to the 2020 Covid low. The index could test the zone between 21,711 and 18,114 – shaded grey on the above chart – sometime in 2023 or maybe 2024.
Keep in mind that the targets on this big-picture chart are only approximate. We derive better targets and trading ideas when we turn to smaller time frames.
For more technical analysis from Trading On The Mark, follow them on Twitter. Trading on the Mark's views and findings are their own, and should not be relied upon as the basis of a trading or investment decision. Pricing is indicative. Past performance is not a reliable indicator of future results.
Disclaimer: CMC Markets is an execution-only service provider. The material (whether or not it states any opinions) is for general information purposes only, and does not take into account your personal circumstances or objectives. Nothing in this material is (or should be considered to be) financial, investment or other advice on which reliance should be placed. No opinion given in the material constitutes a recommendation by CMC Markets or the author that any particular investment, security, transaction or investment strategy is suitable for any specific person. The material has not been prepared in accordance with legal requirements designed to promote the independence of investment research. Although we are not specifically prevented from dealing before providing this material, we do not seek to take advantage of the material prior to its dissemination.


