CFD holding costs
At the end of each day (5pm New York time), CFD positions held in your account may be subject to a charge called a 'holding cost'. The holding cost can be positive or negative, depending on the direction of your trade and the applicable holding rate. Historical holding rates, expressed as an annual percentage rate, are visible on our platform within the overview section for each product.
Calculating CFD holding costs
Holding costs are calculated as follows:
On a buy position:
Daily holding cost = (units x current trade mid-price x holding rate buy) / 365 x CMC Markets currency conversion rate.
On a sell position:
Daily holding cost = (units x –1 x current trade mid-price x holding rate sell) / 365 x CMC Markets currency conversion rate.
The current trade price uses the mid-price at 5pm (New York time) or the last CMC mid-price, if the market is already closed. For New Zealand shares, the closing mid-price of the previous day will be used.
The resulting sum of all holding costs will be credited to or debited from your account as applicable, and will be visible within your account history on the platform.
*Tax treatment depends on individual circumstances. Professional clients only. Capital at risk.
Commodities and treasuries
Holding (or carry/swap) payments are made each night (at 5pm EST, 10pm UK time) for all open CFD trades on treasury and commodity cash (or spot) products, for example UK Gilt - Cash and Natural Gas - Cash.
Cash commodity and treasury products are derivatives, with the prices derived from a scaled futures price. This is updated each night to ensure that the cash price converges to the current primary (most liquid) futures price, by the time the futures contract expires. This scaling update results in an adjustment to the cash price, which is the basis of the holding rate cost.
The holding payments offset the price adjustment, ensuring that our clients pay a fair rate on both buy and sell CFD trades, with neither side benefiting or being disadvantaged by the price adjustment. In addition to the price adjustment, the holding rate also includes a CMC charge to fund the provision of these products. The CMC charge will be whichever is larger of 3% and a proportion of the price adjustment.
Since the holding rates are based on the current primary futures price, they are subject to change as the primary futures contract approaches expiry and is replaced by the next futures contract. However, the price adjustment will also be updated as the primary future is replaced, resulting in no change to the impact on clients’ account value.
Examples
Determining the price adjustment rate
The annualised price adjustment rate can be found as the average of the buy and sell holding rates.
Price adjustment rate = (buy holding rate + sell holding rate) / 2The buy holding rate is then given by subtracting the CMC charge*.
Buy holding rate = price adjustment rate - 3%The sell holding rate is then given by adding the CMC charge*.
Sell holding rate = price adjustment rate + 3%
*The CMC charge is shown as 3% for simplicity.
Impact on account value
To demonstrate that holding payments offset the price adjustment and that the price adjustment rate doesn’t impact the account value, consider this example where the CMC charge is applied separately to the price adjustment rate.
Alice has an account value consisting of £1,000.10 cash, and 1 pound/euro per unit of a commodity with a price of £1.230 (1,230 points).
Her total account value before the holding payment is therefore:
£1,000.10 + 1 £/unit x 1,230 = £2,230.10
At 5pm (EST) the holding payment is due, and the CMC charge on Alice’s position is automatically applied. This incurs a cash charge of 3% / 365 of £1,230 (0.03 x £1230 / 365 = £0.10), resulting in a new account value of
£1,000 + (1 x £1,230) = £2,230.00
At the same time, the cash price is adjusted up towards the futures contract, by 5% / 365 to £1.23017, artificially increasing the value of Alice’s position by 5% / 365 of £1,230 (0.05 x 1,230 / 365 = £0.17) to £1,230.17. To offset this increase, Alice is simultaneously required to pay the price adjustment on her position which is also £0.17.
Her total account value after the holding payment is therefore equal to her account value prior to the price adjustment payment:
£999.83 + (1 x 1,230.17) = £2,230.00
Note that if Alice had placed a short (sell) trade, the direction of the price adjustment payments would be reversed, and she would receive the price adjustment payment, as the value of her position would have decreased.
Short (sell) trade
Initial cash: £1,000.10
Initial position value: 1 £/unit short at a price of 1,230 = £1,230
Initial account value: £1,000.10 + £1,230.00 = £2,230.10
CMC charge: 3% of position = 0.03 x 1,000 x 1.23 / 365 = £0.10
Price adjustment: 5% / 365 results in an increase from £1.23 to £1.23017
Corresponding position value change: -£0.17
Final cash: £1,000.10 - £0.10 + £0.17 = £1,000.17
Final position value: 1 £/unit short at a price of 1,2915 = 1,000 x (£1.23 - (£1.23017 - £1.23)) = £1,229.83
Final account value: £1,000.17 + £1,229.83 = £2,230
Long position with higher price adjustment rate
Initial cash: £1,000.10
Initial position value: 1 £/unit long at a price of 1,230 = £1,230
Initial account value: £1,000.10 + £1,230.00 = £2,230.10
CMC charge: 3% / 365 of position = 0.03 x 1,000 x 1.23 / 365 = £0.10
Price adjustment: 15% / 365 results in an increase from £1.23 to £1.23051
Corresponding position value change: +£0.51
Final cash position: £1,000.10 - £0.10 - £0.51 = £999.49
Final position value: 1 £/unit long at a price of 1,230.51 = 1,000 x £1.23051 = £1,230.51
Final account value: £999.49 + £1,230.51 = £2,230
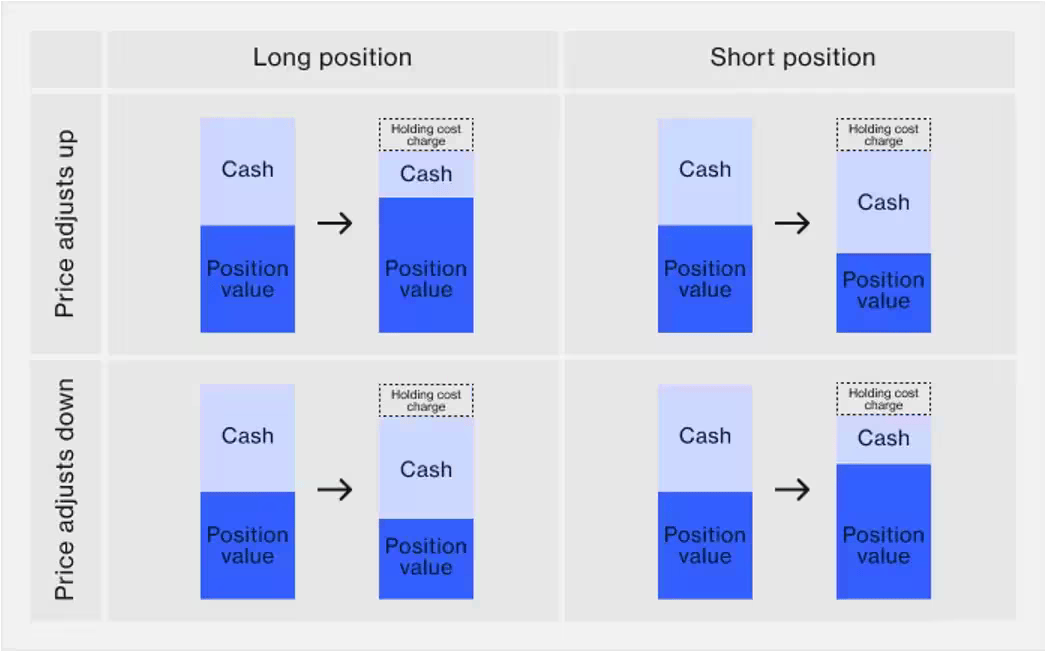
Holding costs visual representation
The graphic below represents the four possible holding cost scenarios. The height of each column represents the total account value, calculated from the position value and cash balance in the account. In every scenario, the account value is only reduced by the CMC charge, regardless of the value of the price adjustment rate.
Shares
Overnight fees for share CFDs are based on the underlying interbank rate for the currency of the relevant share (see table below), plus 0.0082% on buy positions and minus 0.0082% on sell positions.
Holding costs are charged for buy positions and credited for sell positions, unless the underlying interbank rate is equal to or less than 0.0082%, in which case sell positions may incur a holding cost charge that will be deducted from the cash in your account. Holding rates for sell trades may also include an additional adjustment for borrowing fees on shares that attract a higher borrowing cost in the underlying market. These borrowing fees can be significant and are subject to large changes as short interest in a stock increases. Please be aware of this additional risk/charge when holding sell trades in individual shares.
Indices
Overnight holding rates for index CFDs are based on the underlying interbank rate of the index (see table below), plus 0.0082% on buy positions and minus 0.0082% on sell positions.
Risk-free and interbank rates for shares, share baskets and 'cash' indices
Foreign exchange
Overnight holding rates for forex CFDs are based on the tom-next (tomorrow to next day) rate in the underlying market for the currency pair and are expressed as an annual percentage.
Buy position holding rate = tom-next rate % + 0.0027%
Sell position holding rate = tom-next rate % - 0.0027%
Different rates are quoted for buy and sell positions and are actively traded between banks. Tom-next rates in the underlying market are based on the interest rate differential between the two currencies. As a general rule, if the interest rate of the first named currency is higher than the second named currency in the forex pair (subject to the adjustment detailed above), and you hold a buy position, the holding cost will be credited to your account. Conversely, if you hold a sell position in this scenario, the holding cost will be debited from your account.
Simplified calculation used to generate the annual holding cost rate price for cash commodities and treasuries
Subtract the mid-price of the current cash price from the mid-price of the next primary contract to get the price difference
Calculate the number of days to expiry between the next primary contract and now
Divide the price difference by the number of days to expiry and multiply by 365 to get the annualised difference in price terms
Divide the annualised price difference by the cash price to work out the percentage mid-rate
Bid or long position = (percentage mid-rate + (maximum of (absolute of the percentage mid-rate x the CMC charge) or 3%)) x –1
Ask or short position = (percentage mid-rate – (maximum of (absolute of the percentage mid-rate x the CMC charge) or 3%)) x –1
Example
Let's say that the Crude Oil Brent primary contract moved from June to July on 28 April at approximately 9.30pm (UK time).
Crude Oil Brent July Future mid-price 47.48 – Crude Oil Brent Cash mid-price 47.79 = –0.31
Expiry of July contract 30 May-28 April = 33 days
–0.31 / 33 x 365 = –3.42879
–3.42879 / 47.79 = –7.175%
Bid or long position = (–7.175% + 3%) x –1 = 4.175%
Ask or short position = (–7.175% - 3%) x –1 = 10.175%
Share baskets, forex & commodity indices
Holdings costs for share baskets, forex indices and commodity indices are calculated via a weighted sum of the constituents' holding cost rates, plus CMC's charge on buy positions or minus CMC's charge on sell positions.
Forward contracts
A forward contract is a product with a fixed expiration or settlement date, upon which open positions will be settled at the closing price. Index, FX, commodity and treasury forward contracts are not subject to holding costs.
Contracts for difference (CFD) fees include holding costs for trades held overnight, plus market data fees and commission charges if you trade shares. Read an overview of the main CFD costs.
CFD trading can be profitable if you correctly predict the price direction of an asset, and close out your trade at the right time. However, there are additional costs to consider depending on how you trade, including holding costs for trades held overnight, and commission charges on share trades. Trading with leverage is also a risk because profits and losses are magnified based on the full trade value. CFD trading is also subject to capital gains tax. Read more about the risks of CFDs.
No, CFD trading is not tax free, as you have to pay capital gains tax on any profits you make. There's no stamp duty to pay, however, as you don't take ownership of the underlying asset.
Spread betting is an alternative form of derivative trading in the UK and Ireland that is tax-free. Tax treatment depends on individual circumstances and may be subject to change in the future.You can hold CFD trades for any duration between a few seconds to several months. However, you will be subject to overnight holding costs if carrying any positions over, which can be positive or negative depending on the size and direction of the position. Find out more about overnight CFD fees.
You can trade CFDs both in the short-term and long term. View our guide to the best trading strategies to use in the financial markets, including short-term day trading, medium-term swing trading and long-term position trading.
Disclaimer: CMC Markets is an execution-only service provider. The material (whether or not it states any opinions) is for general information purposes only, and does not take into account your personal circumstances or objectives. Nothing in this material is (or should be considered to be) financial, investment or other advice on which reliance should be placed. No opinion given in the material constitutes a recommendation by CMC Markets or the author that any particular investment, security, transaction or investment strategy is suitable for any specific person. The material has not been prepared in accordance with legal requirements designed to promote the independence of investment research. Although we are not specifically prevented from dealing before providing this material, we do not seek to take advantage of the material prior to its dissemination.

