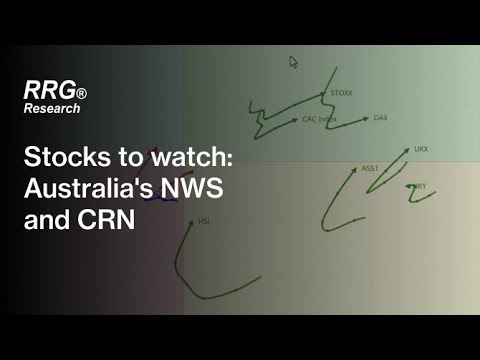
As usual, let us start with a global overview. The weekly Relative Rotation Graph (RRG) of world stock market indices, below, offers up some interesting observations.
First, the four US indices we watch – the S&P 500 (SPX), the Dow (INDU), the Russell 2000 (RTY) and the Nasdaq (NDX) – all have a JdeK RS-Ratio of more than 100, placing them on the right of the chart. However, none of them is heading in a positive, north-easterly direction. Instead, they are turning back on themselves, signalling a possible downturn.
Meanwhile, Hong Kong’s Hang Seng Index (HSI) can be seen heading deeper into the lagging quadrant – an issue we explore in more detail later in the article.

Drilling down, the daily RRG, below, reveals that the four US indices have sub-100 JdeK RS-Ratio readings, positioning them on the left of the chart. They seem to be heading in a negative, south-westerly direction, suggesting that their underperformance could persist in the near term.

Hang Seng’s struggles continue
Last week we highlighted the deteriorating performance of the Hang Seng Index, which has entered the lagging quadrant of our weekly and daily RRGs, above. HSI’s long move through the weakening quadrant into the lagging quadrant indicates that it is underperforming our benchmark, the MSCI World Index.
The weekly price chart, below, shows the long-term downtrend in more detail. Since the start of 2021, a series of lower highs and lower lows have formed within the boundaries of a falling channel. The index has recently broken below the low spike set in March. This could trigger another move lower, sending the tail on our RRG even deeper into the lagging quadrant.

How do we use RRG data to generate trading ideas?
Last week, we outlined how our data can be used to generate potential trading ideas. Using specific characteristics unique to Relative Rotation Graphs, we scan a large universe of assets in search of actionable ideas.
One element that we always look for is the RRG-Heading on a tail. When a tail travels at an RRG-Heading of 0-90 degrees – that is to say, in a south-east direction – the asset is gaining in terms of relative strength and momentum.
A second element is RRG-Velocity. This is the distance between the observations on the tail. The longer the length, the stronger the move. We therefore pay close attention to assets with increasing RRG-Velocity.
Finally, we also scan our data for potential long trades, which means we look for assets that are going up in price. More specifically, we look for assets that are trading above their 10-day moving average.
In summary, then, we are looking for assets which:
1. Have rotated into a 0-90 degree RRG-Heading
2. Have increasing RRG-Velocity over two periods
3. Are trading above their 10-day moving averages
Over a 20 year period stretching from January 2000 to January 2020, the above criteria were met by stocks in the FTSE 350 on more than 16,000 occasions.
Scanning Australia’s ASX 200 for inspiration
After the close on Thursday 22 September, we applied the above methodology to Australia’s leading index, the ASX 200, and plotted the results on the below RRG. Then we checked the price chart for the two stocks that bubbled up to the surface: News Corporation [NWS] and Coronado Global Resources [CRN].

Coronado Global Resources (CRN) may be one to watch
Steel industry supplier CRN’s share price is on the up. The stock is heading towards overhead resistance at $1.87, with the potential to break through this level and open up further upside. The longer-term picture appears positive, following a pattern of rising lows in recent weeks.

News Corporation [NWS] worth monitoring
The Rupert Murdoch-founded media company News Corp dropped to a key support level at $22 this year, but the weekly moving average convergence divergence (MACD) line indicates increased upside momentum.
Although the stock has pulled back in recent weeks, a move back towards the recent high at $27.40 would point to a resumption of the uptrend. After that, there seems to be little resistance until $29. Strong resistance kicks in from $30 to the high of around $34.

Pricing is indicative. Past performance is not a reliable indicator of future results. RRG’s views and findings are their own and should not be relied upon as the basis of a trading or investment decision.

Find your flow: four principles for trading in the zone
Learn about the four trading principles of preparation, psychology, strategy, and intuition, and gain key trading insights from some of the world's top investors.
Get this free report
Disclaimer: CMC Markets is an execution-only service provider. The material (whether or not it states any opinions) is for general information purposes only, and does not take into account your personal circumstances or objectives. Nothing in this material is (or should be considered to be) financial, investment or other advice on which reliance should be placed. No opinion given in the material constitutes a recommendation by CMC Markets or the author that any particular investment, security, transaction or investment strategy is suitable for any specific person. The material has not been prepared in accordance with legal requirements designed to promote the independence of investment research. Although we are not specifically prevented from dealing before providing this material, we do not seek to take advantage of the material prior to its dissemination.