Stock markets in short-term uptrend
The Relative Rotation Graph (RRG) below plots the rotation of a group of international stock market indices against a 0% return. Over the last week the majority of indices have moved towards and into the leading quadrant, signalling a short-term uptrend in terms of price. For traders and investors, that comes as welcome news after a period of declines.
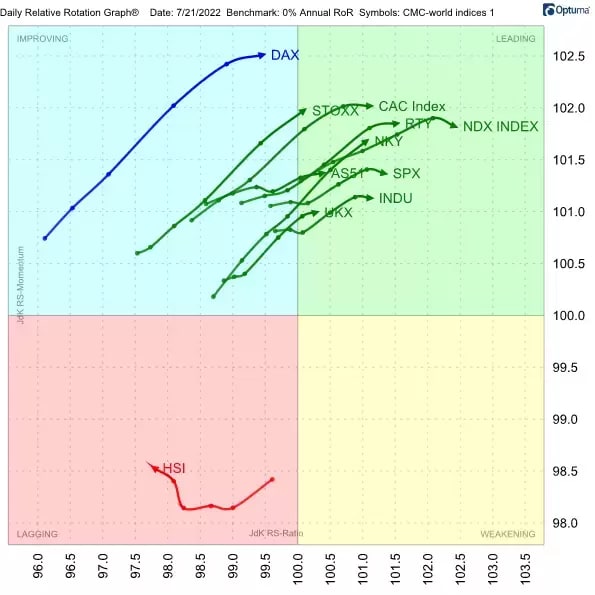
The only market that is swimming against the tide at the moment is Hong Kong’s Hang Seng index [HSI], which is in the lagging quadrant and moving lower on the RS-Ratio scale. For the rest, the question now is whether these rallies are sustainable. The answer should become apparent over the coming weeks.
Europe gains on US
When we compare the above group of indices to the MSCI World Index, we get a different picture.

Here, the tails that stand out for us are the European markets – Germany’s Dax, the pan-Eurozone Stoxx 50 and France’s Cac 40. All are travelling in a positive direction, in or towards the leading quadrant.
In contrast, the US indices – the S&P 500 [SPX], the Dow Jones [INDU] and the Nasdaq 100 [NDX] – have turned and are now heading in a negative direction, in or towards the weakening quadrant.
RRGs can help highlight these types of opposing moves. At the moment, the contrasting rotations of European and US markets appear noteworthy, and may provide possible pair-trading opportunities. Let’ s take a closer look at a pair of these indices – the Stoxx 50 and the S&P 500.
Stoxx 50 versus S&P 500
The Eurozone’s Stoxx 50 index, having bottomed around 3,400 a number of times in the last few months, now appears ready to move beyond resistance around 3,600. A break above that level could free up further upside potential, potentially giving the index scope to target the 3,800 area.
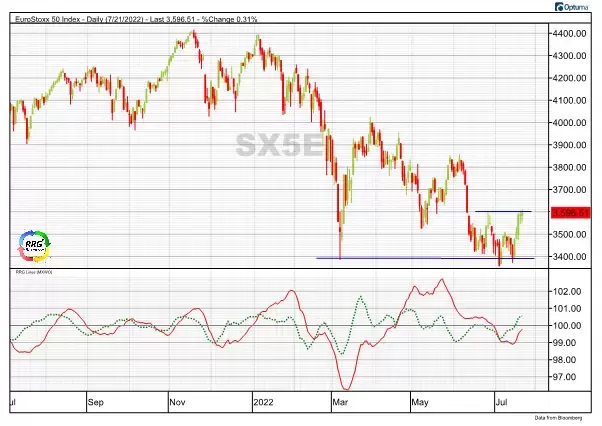
Even more important are the RRG Lines at the bottom of the above image. These lines are moving higher and pushing the Stoxx 50's tail towards the leading quadrant in the second RRG that we looked at in this article. This movement underscores the current relative strength of the European market.
Now let’s look at the S&P 500. From a price perspective, this US index dipped deeper but recovered a bit more quickly. That recovery, which indicates the index’s relative strength, is now stalling and Europe is taking over.
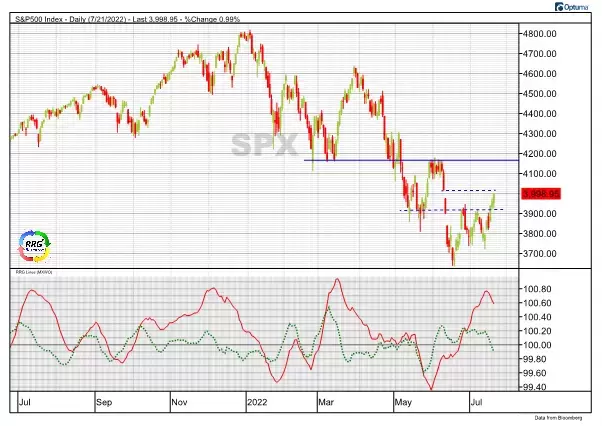
The chart above shows that the June low was much deeper for the S&P 500 than for the Stoxx 50. It also illustrates how the US rallied out of the June low while Europe was still in a range, with the balance now tipping in favour of Europe.
From a price perspective, both the Stoxx 50 and the S&P 500 have upside potential. But on a relative basis, the former is beating the latter.
Growth stocks and sectors pick up
A quick look at the rotation for US sectors reveals that the recent rally in the market has been driven by growth stocks. Both information technology and consumer discretionary are in the leading quadrant, signalling strong momentum. These two sectors account for almost 50% of the S&P 500’s market capitalisation, so it is no surprise that they are lifting the index higher.

However, the question once again is whether these moves are sustainable over a longer period. Also, how do these moves fit in to the bigger picture? One of the relationships that I’m tracking to monitor this situation is the relationship between growth and value stocks.
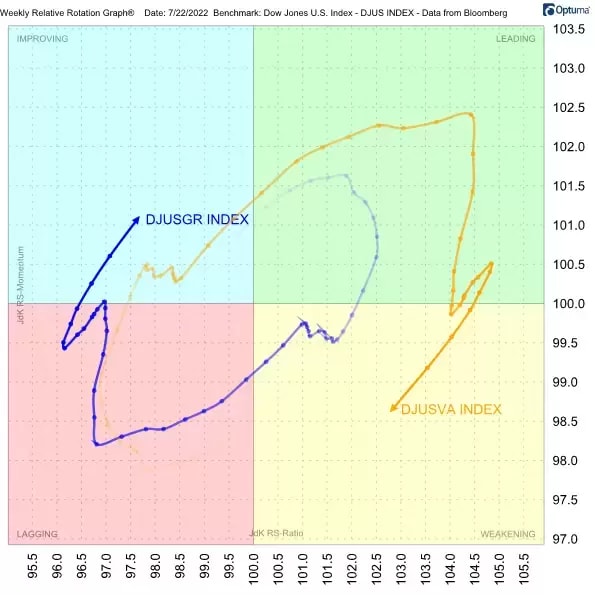
The RRG above measures the rotations for the Dow Jones US Growth Index [DJUSGR] and the Dow Jones US Value Index [DJUSVA] against the Dow Jones US Index for the week to 22 July. The recent improvement for DJUSGR and the weakening of DJUSVA is clearly visible. But we have to keep in mind that the Value Index is still on the right-hand side of the graph and thus is in a relative uptrend versus the benchmark. Given their distance from the centre of the chart, it is still possible for both tails to complete their rotations on the same side of the graph.
Massive top in place for growth-value relationship
Plotting the Growth Index against the Value Index, as shown in the long-term chart below, paints an interesting and perhaps sobering picture. After a period of preference for Growth over Value dating back to 2006, this relationship has recently completed a massive double-top formation.

This development cannot be ignored. First, we saw a decline that broke below the support level that was set between the two peaks. And now we’re seeing a rally back towards that breakout level.
From a long-term perspective it looks as if the relationship is now under pressure. It will be very interesting to see what happens once this ratio goes back to 1.38 or maybe 1.40, and to see the impact on the rotation for growth sectors. We will have to watch this space. For now, the data suggest that the current rally for growth sectors and stocks appears to be temporary in nature.
Pricing is indicative. Past performance is not a reliable indicator of future results. RRG’s views and findings are their own and should not be relied upon as the basis of a trading or investment decision.
Disclaimer: CMC Markets is an execution-only service provider. The material (whether or not it states any opinions) is for general information purposes only, and does not take into account your personal circumstances or objectives. Nothing in this material is (or should be considered to be) financial, investment or other advice on which reliance should be placed. No opinion given in the material constitutes a recommendation by CMC Markets or the author that any particular investment, security, transaction or investment strategy is suitable for any specific person. The material has not been prepared in accordance with legal requirements designed to promote the independence of investment research. Although we are not specifically prevented from dealing before providing this material, we do not seek to take advantage of the material prior to its dissemination.


