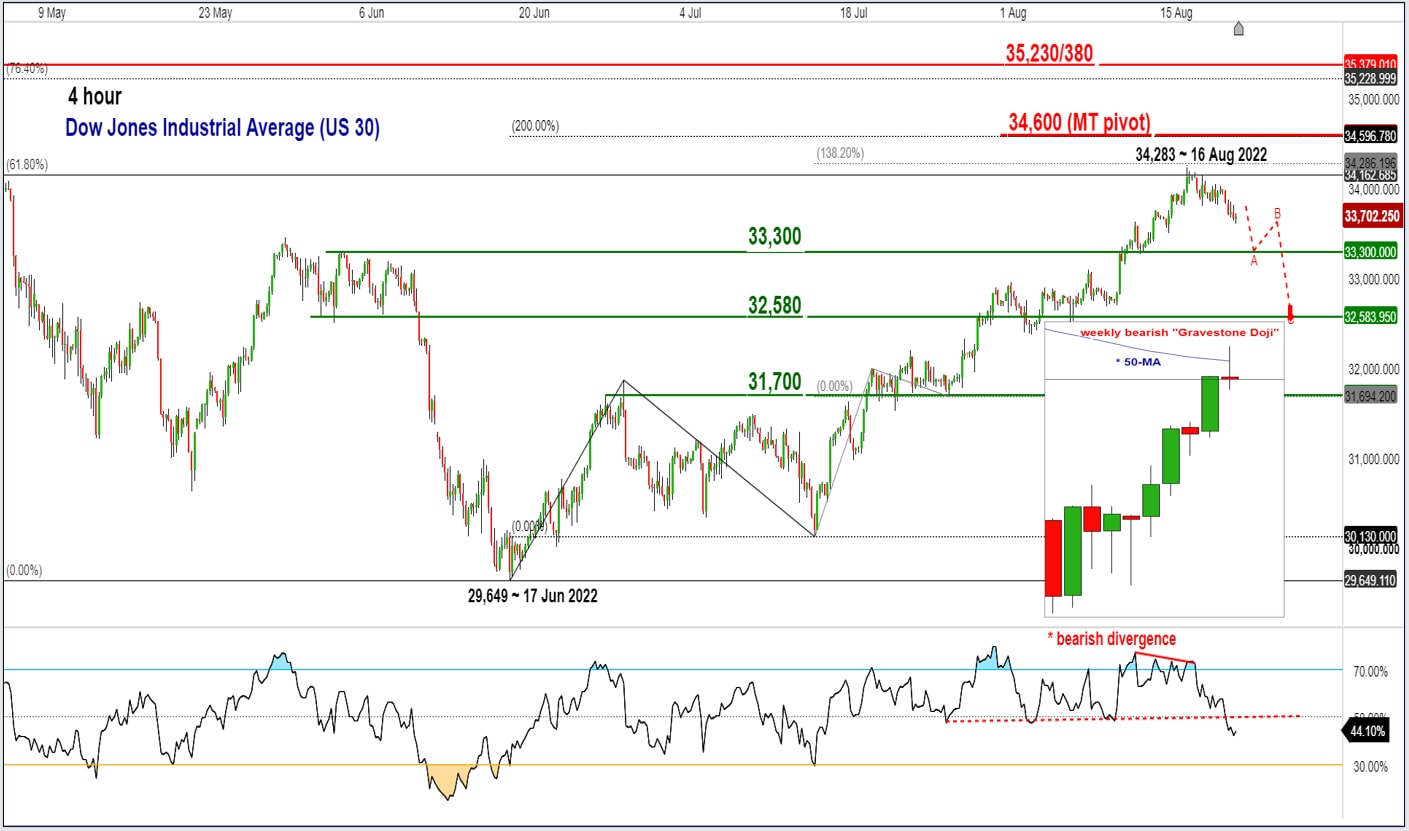
Chart of the week – Dow Jones Industrial Average (US 30)
Short-term technical analysis (1 to 3 weeks)

Time-stamped: 21 August 2022 at 12:30pm (SGT)
Source: CMC Markets
- The recent two-month rally of 16% seen in the US 30 Index (a proxy for the Dow Jones Industrial Average) from its 52-week low of 29,649 printed on 17 June 2022 to its recent high of 34,285 on 16 August 2022 has run into a roadblock coupled with the emergence of several bearish elements from a technical analysis perspective.
- Hence, exhaustion and fatigue may be around the corner for the bulls. Bearish bias below 34,600 key medium-term pivotal resistance for a potential drop towards the following supports at 33,300 and 32,580.
- On the flip side, a clearance with a 4-hour close above 34,600 put the bearish tone on hold for a squeeze up towards the next resistance at 35,230/380 (29 March/21 April 2022 swing highs & 76.4% Fibonacci retracement of the last major downtrend phase from 5 January 2022 all-time high to 17 June 2022 low).
- Negative elements; last Friday’s price actions ended with a weekly bearish “Gravestone Doji” reversal candlestick pattern after a failure to close above the 50-week moving average that has capped previous rallies since April 2022, Elliot Wave/fractal analysis has indicated that the two-month rally has reached an inflection zone of 34,300/600 which increases the odds of a bearish reversal, short-term downside momentum has resurfaced from the negative observations seen in the 4-hour RSI oscillator as it has flashed a prior bearish divergence signal at its overbought region coupled with a recent bearish breakdown from its corresponding support at the 50% level.
Disclaimer: CMC Markets is an execution-only service provider. The material (whether or not it states any opinions) is for general information purposes only, and does not take into account your personal circumstances or objectives. Nothing in this material is (or should be considered to be) financial, investment or other advice on which reliance should be placed. No opinion given in the material constitutes a recommendation by CMC Markets or the author that any particular investment, security, transaction or investment strategy is suitable for any specific person. The material has not been prepared in accordance with legal requirements designed to promote the independence of investment research. Although we are not specifically prevented from dealing before providing this material, we do not seek to take advantage of the material prior to its dissemination.


