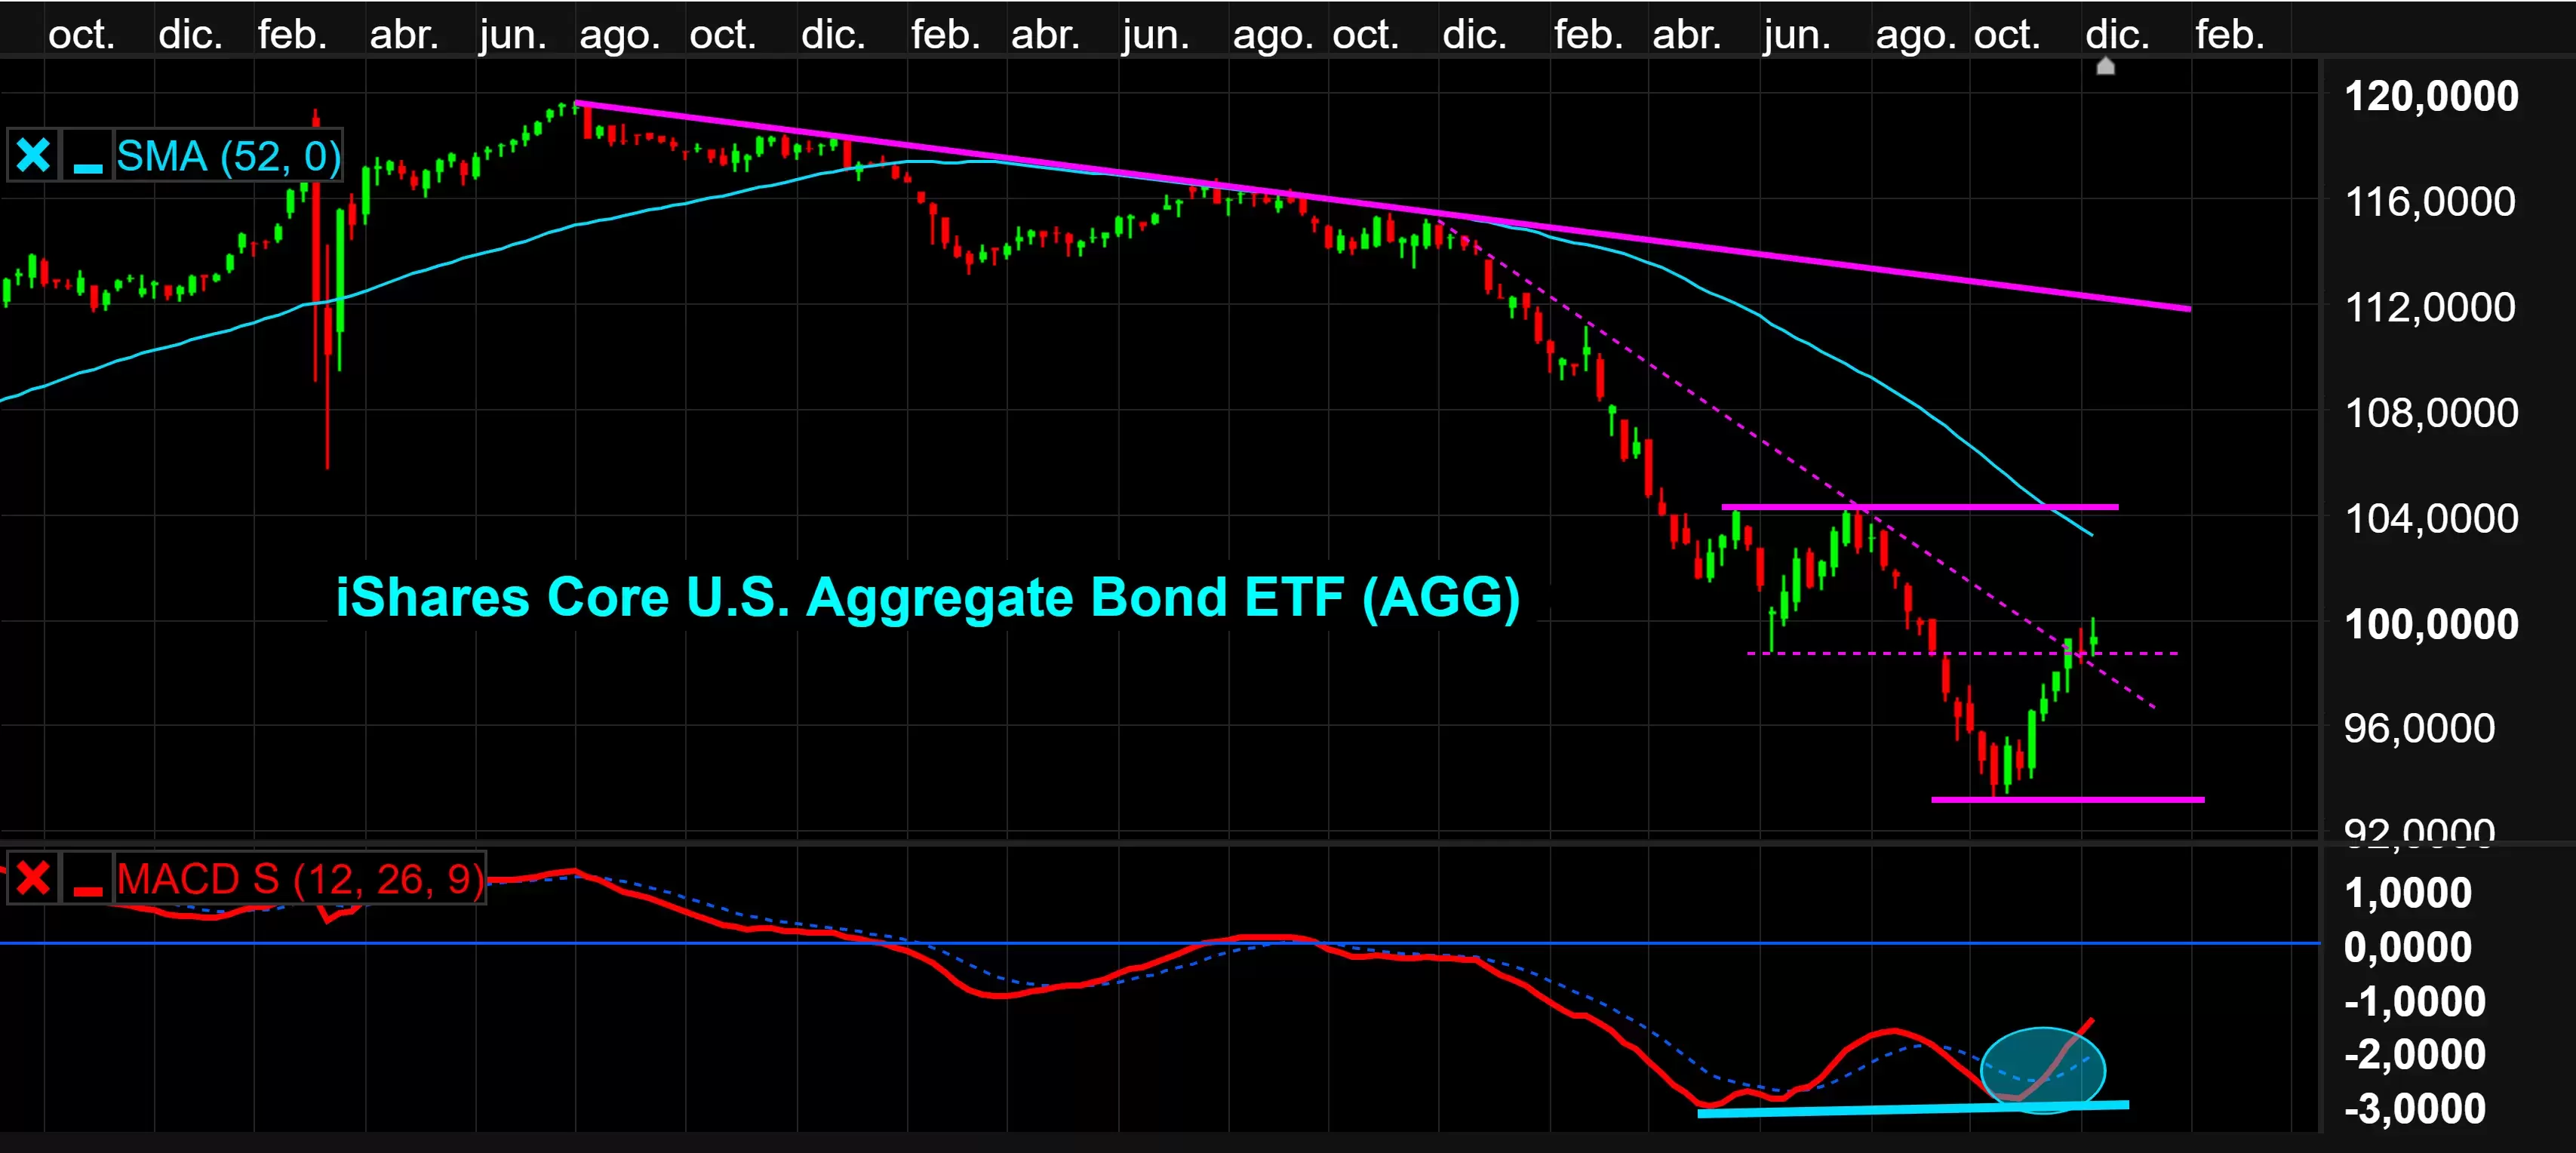
The 2022 collapse in the bond markets has been historic. Bonds have not been a safe haven this year. The bond classes closest to the mistakenly named "risk asset" are down around 10 percentage points so far this year. One example is the Vanguard Total Bond Market Index Fund (BND), which has lost around 13% so far this year, investing its more than $80bn of assets in short-term US investment grade bonds: treasuries, corporates, MBS and agencies. The iShares Core US Aggregate Bond ETF (AGG) has had similar declines.
iShares Core US Aggregate Bond ETF with MACD weekly chart
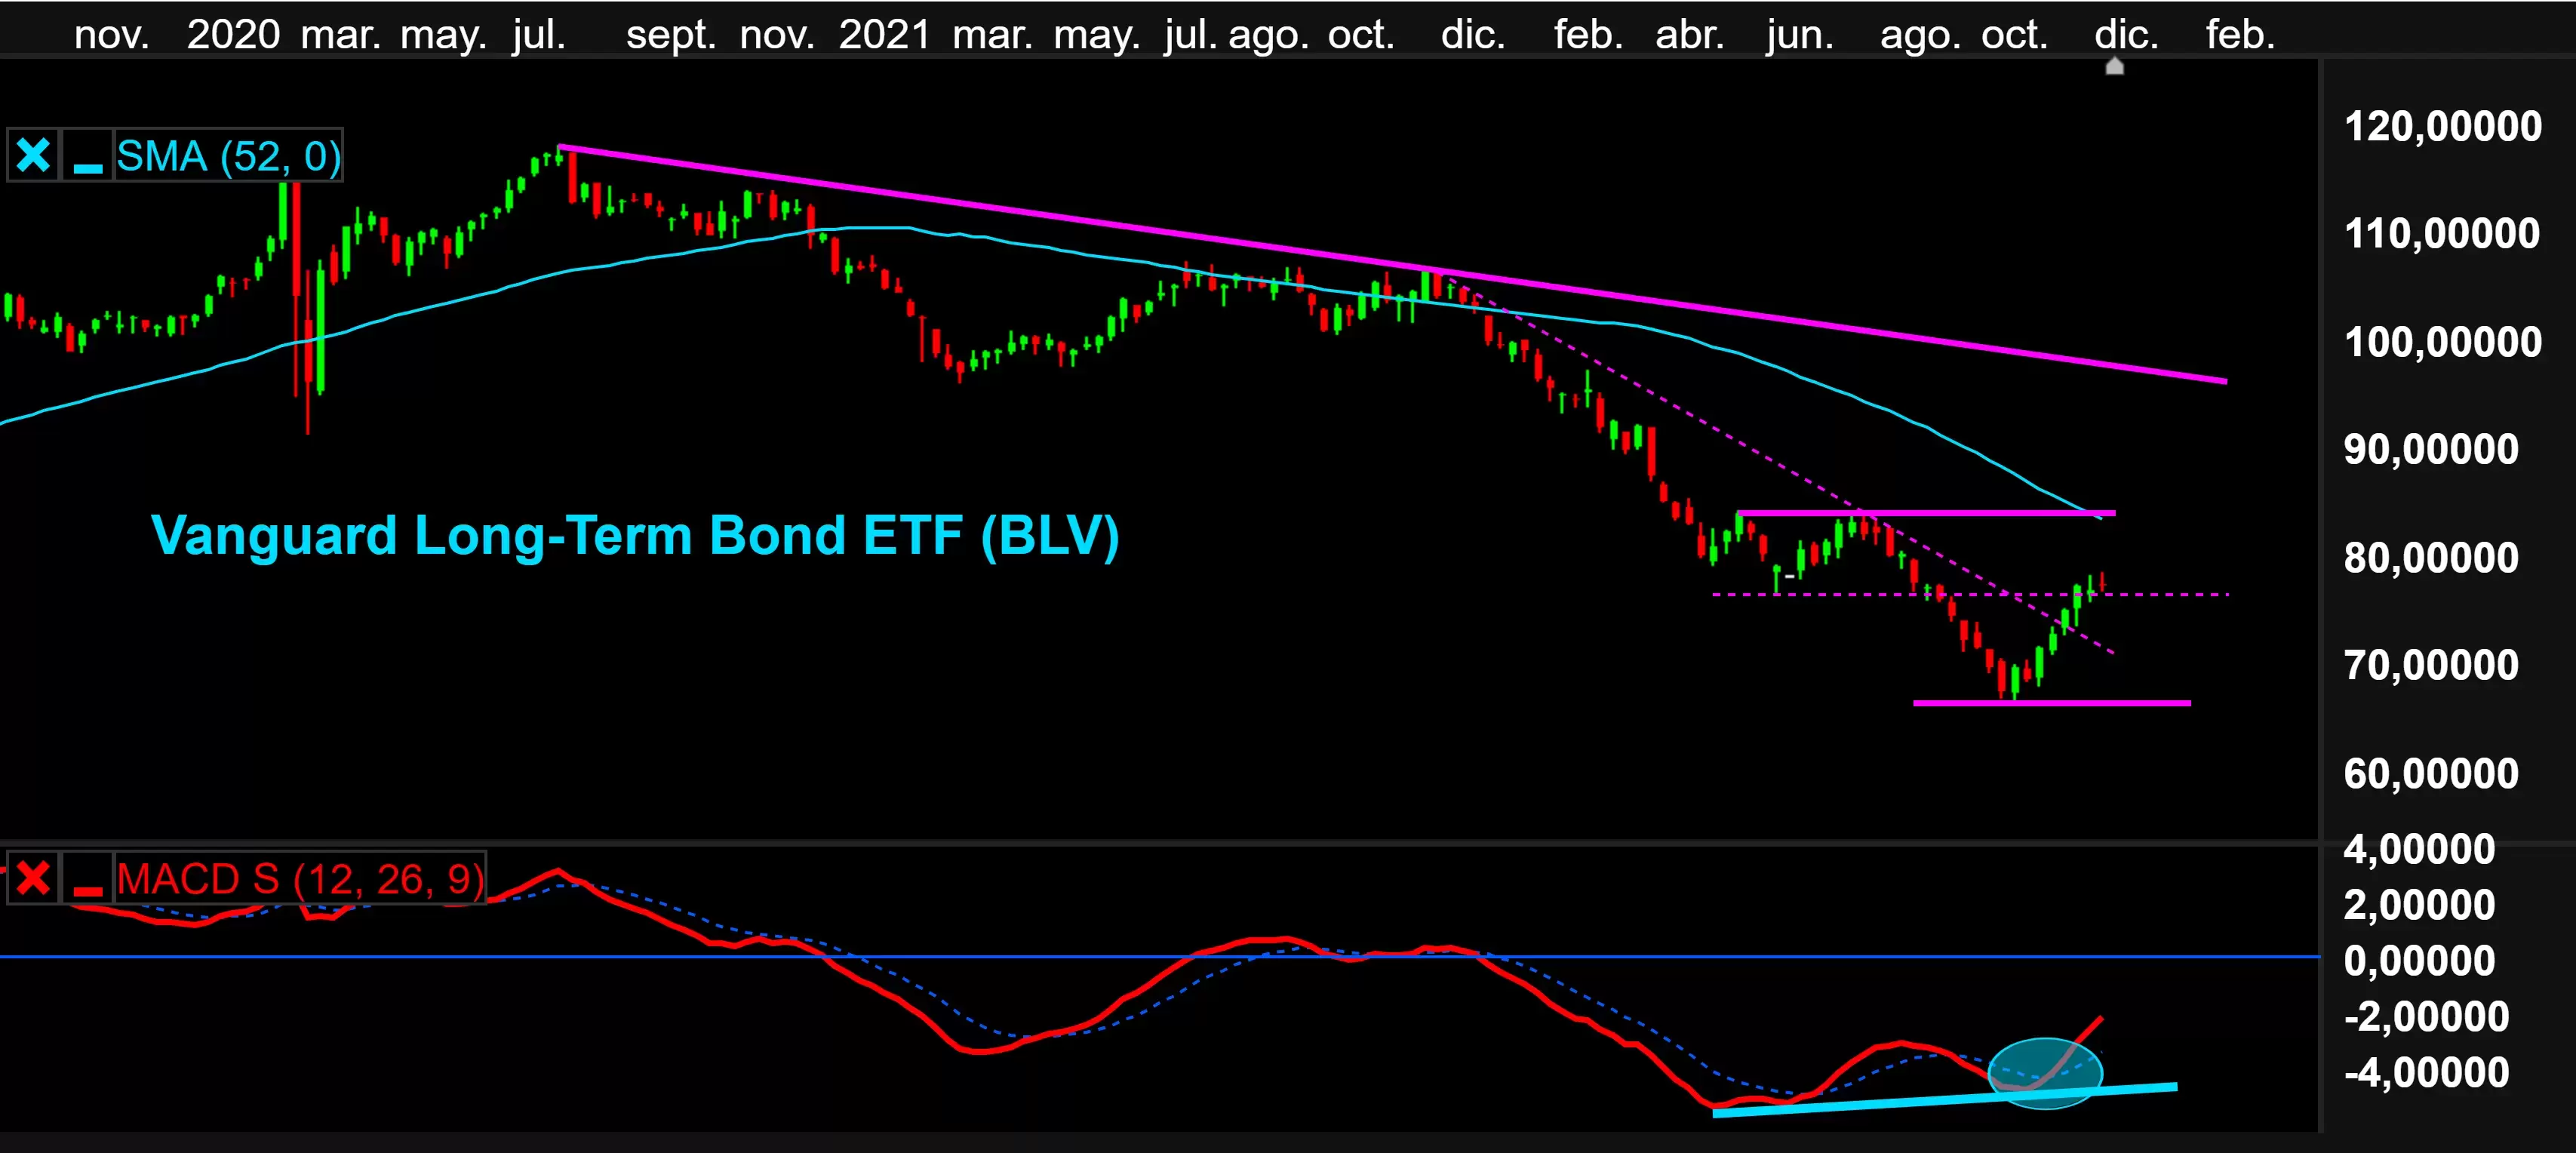
The punishment has been widespread; the sharp rise in interest rates to fight inflation, led by the US, has spread globally. The Vanguard Total International Bond ETF (BNDX) also suffers declines of more than 10 percentage points year-to-date, investing in non-USD denominated sovereign bonds with very high credit ratings of AA and above. The falls have been hardest in the categories with the worst credit ratings, and the longest portfolio duration: the Vanguard Long-Term Bond ETF (BLV), with bond durations of more than 10 years, is down more than 25%.
Vanguard Long-Term Bond ETF with MACD (12,26,9) weekly chart
Capitulation possible: oversold and extremely volatile with heavy outflows
Investors have suffered from excessive volatility. Conservative risk profiles accustomed to few scares have reacted with selling, and the outflow of money from the fixed income category is unprecedented. According to the US Investment Company Institute (ICI), withdrawals in the fixed income category, including mutual funds and ETFs traded in the US, have exceeded $300bn so far this year; a higher withdrawal than that experienced during the first quarter of 2020 during the pandemic crash.
In the latter part of 2022, prices have started to stabilise in shorter maturities, and bounce strongly in bonds with longer maturities. This behaviour has caused the MACD (12,26,9) with weekly data to start triggering buy signals from extremely oversold levels (see charts of the AGG and BLV ETFs), suggesting a recovery accompanied by bullish divergences.
US T-Note 2YR with average true range (14) weekly chart
Inflation peaks and expectations anchored
The rise in bond prices coincides with the peak in US inflation. Headline inflation in the US has been gradually receding after setting a year-on-year high of 9.1%, a level not seen since the 1970s. This is a peak that fits in with the Federal Reserve's economic forecasts, according to the latest FOMC projections. Core inflation will average 3.1% annually in 2023 and 2.1% in 2024. A declining path also occurs when we look at the ECB's economic projections, of 3.4% on average in 2023, and 2.3% in 2024.
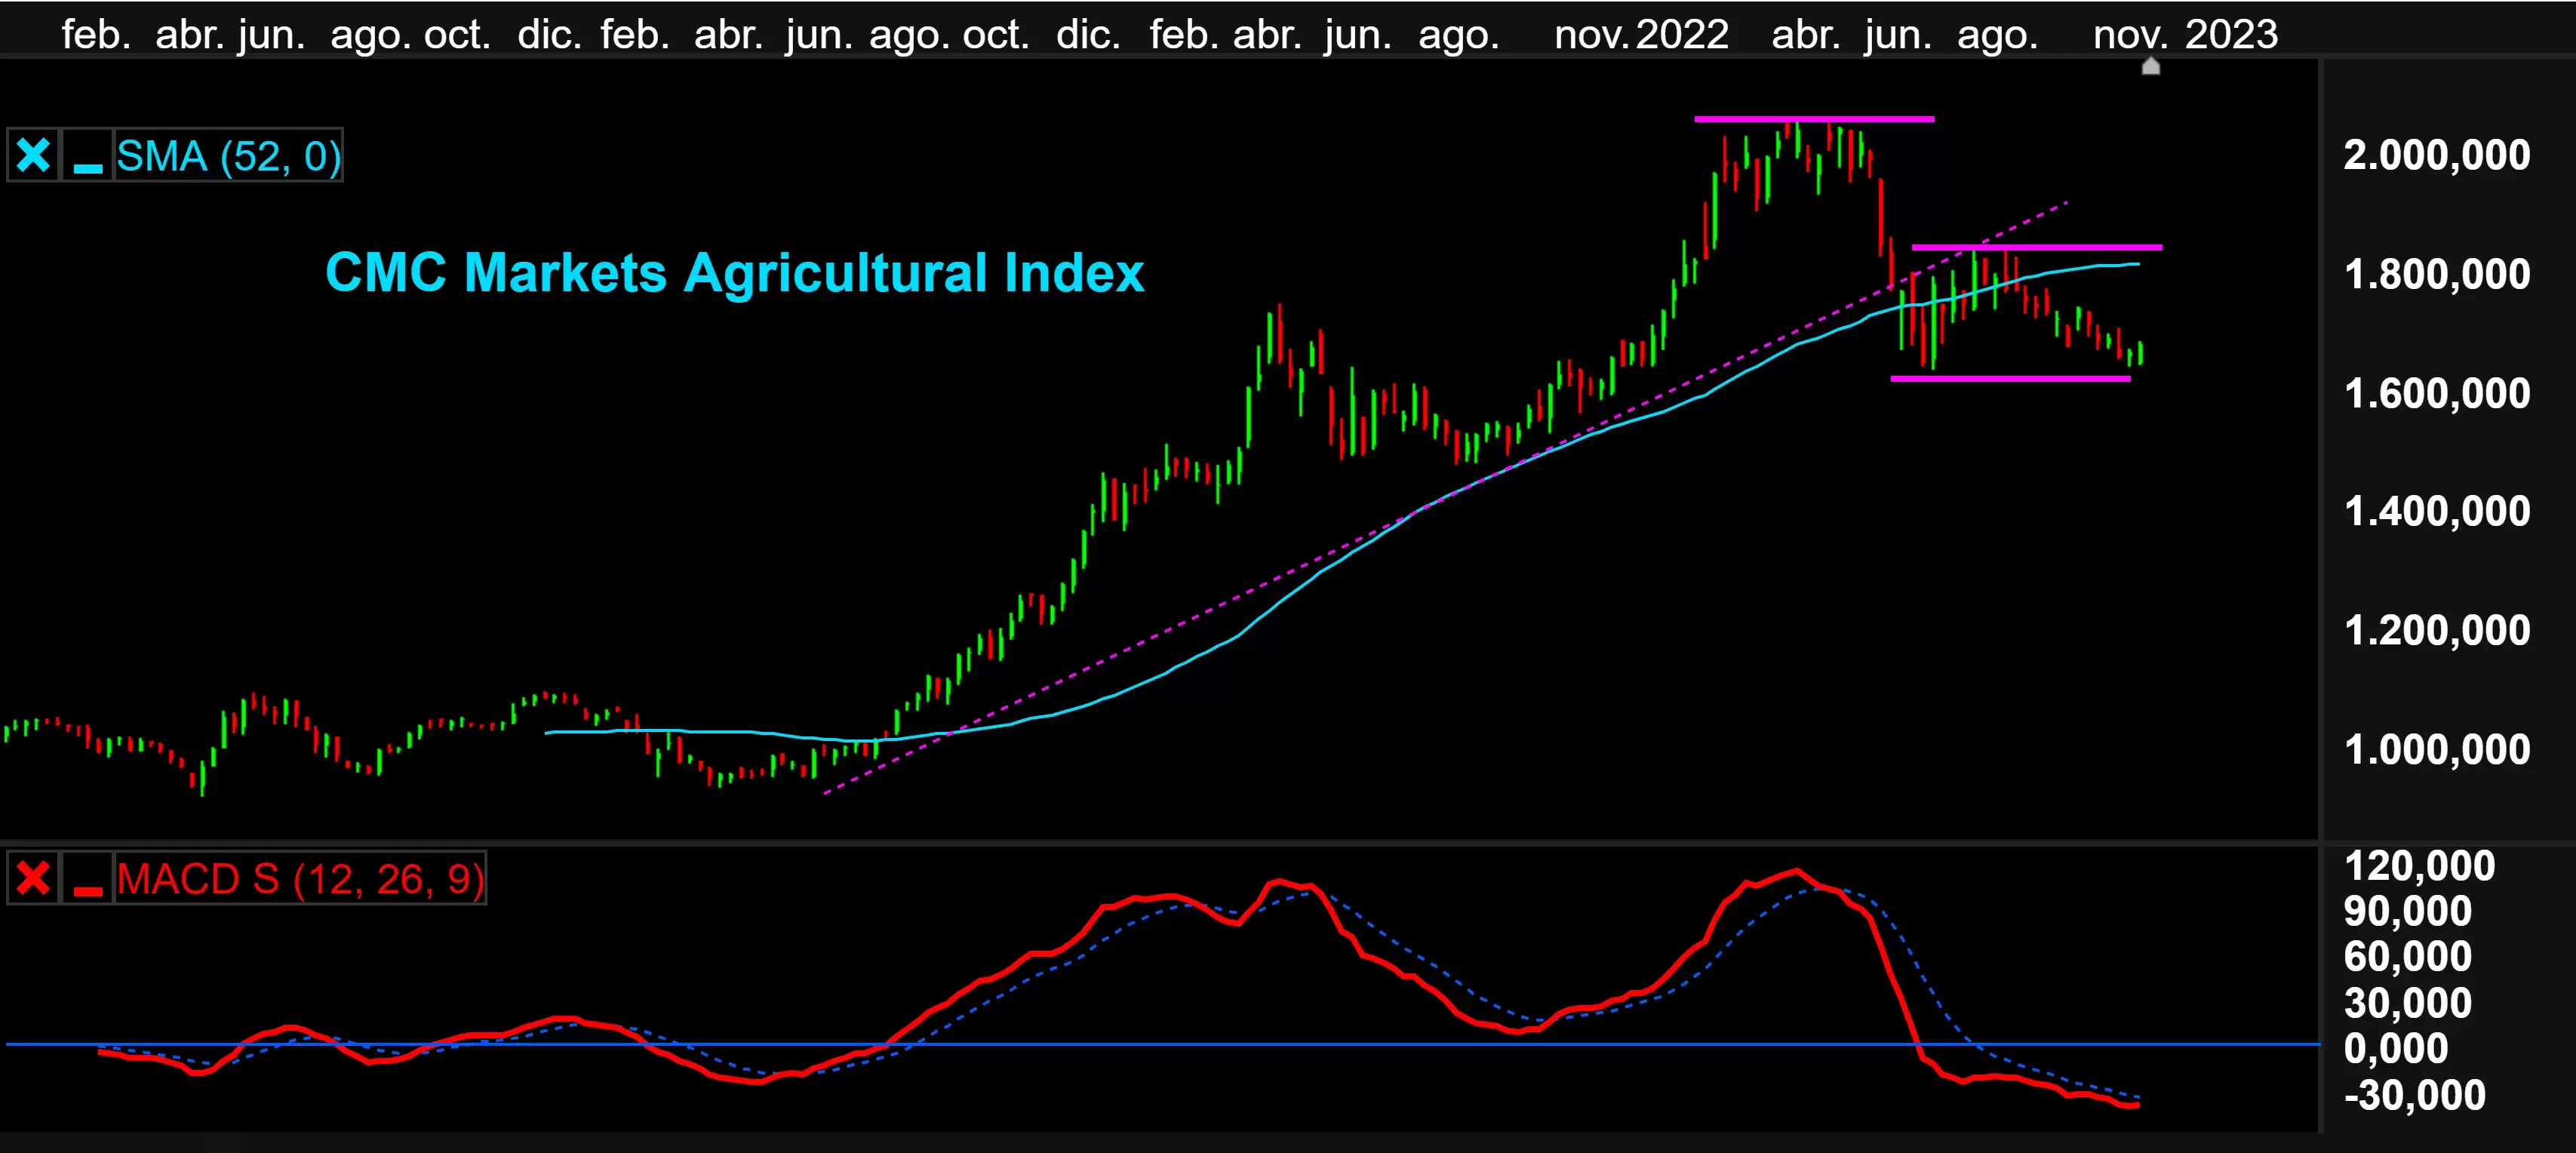
CMC Markets Agricultural Index weekly chart

The source of inflation, which was the sharp rebound in commodity prices, particularly energy and food, is receding. In fact the CMC Agricultural Index and the CMC Energy Index have been trading below their 52-week averages for several weeks, and more than 25%away from the highs reached in the first quarter of 2022.
After bottoming out, will there be a 2023 recovery in bonds?
Although the first steps have been taken, the floor in bonds is yet to be confirmed. If we look at the Fed funds futures discount, the ceiling is just around the corner in the US, no more than 5% in the first quarter. On the other hand, if we look at the slope of the curve between the 10 and 2-year notes, as a leading indicator, we find that the probability of recession is the highest in the last 40 years.
US 10-year and 2-year Treasury Notes vs S&P 500 spread chart
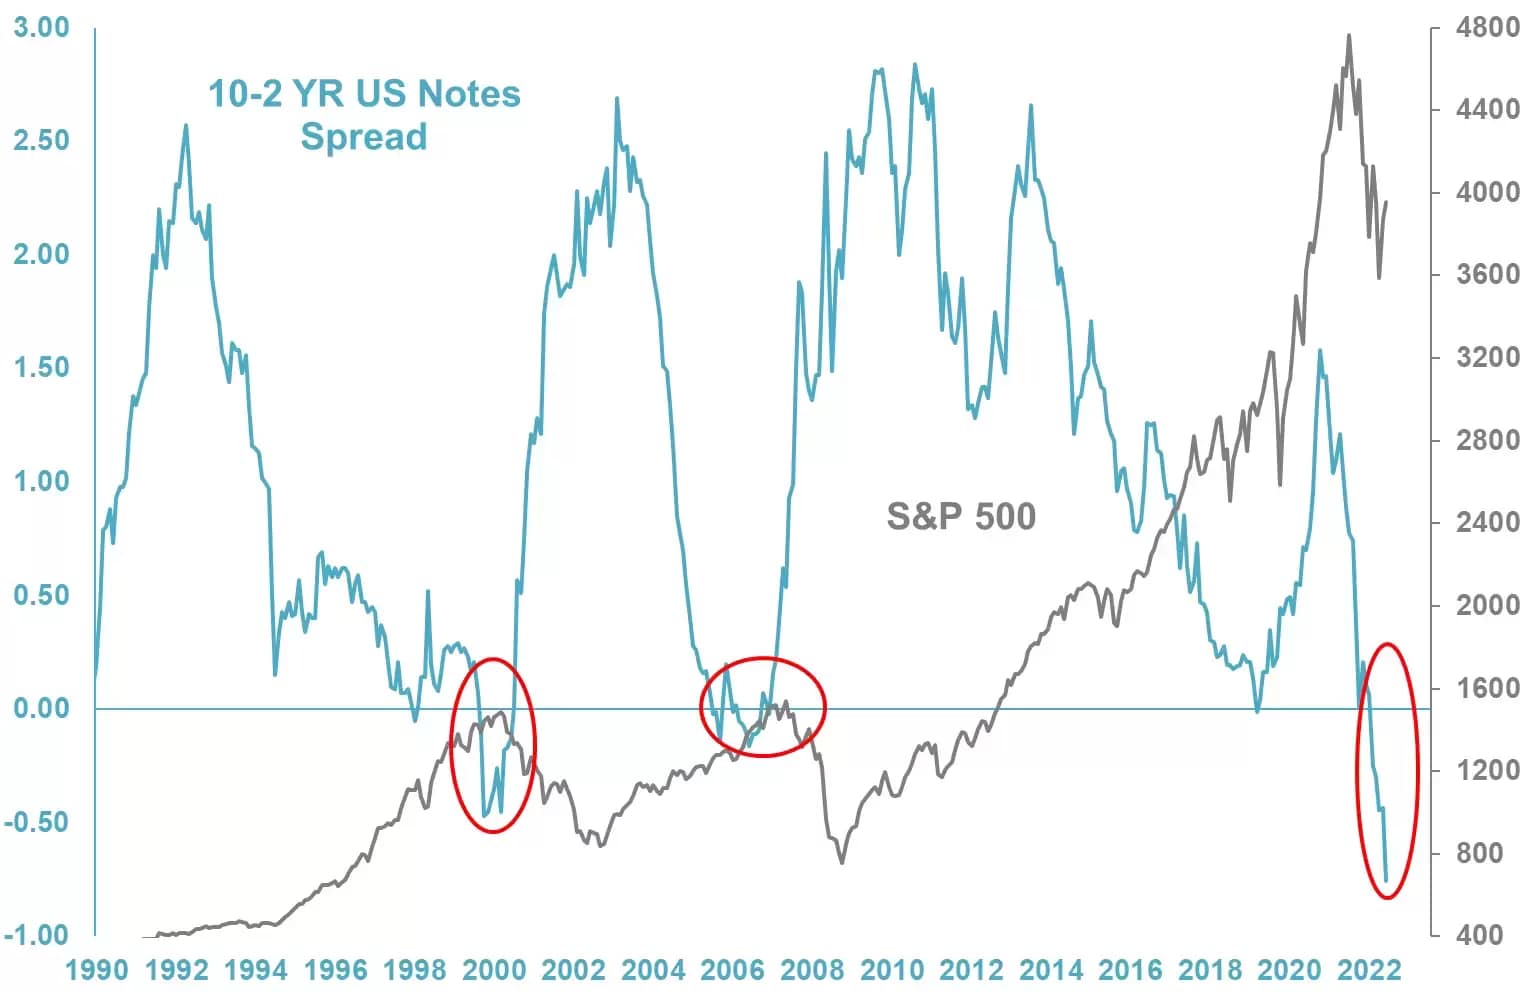
Recession in the US could confirm the bottom in bonds. In this regard, it should be noted that S&P 500 corporate earnings may be contracting at present, according to S&P Dow Jones Indices. Thus, the floodgate of flows from stocks to bonds could begin to open. If the intensity of the recession is strong, and corporate earnings are falling sharply, the floodgate will open further, which is likely to translate into a stronger recovery in bonds.
Disclaimer: CMC Markets is an execution-only service provider. The material (whether or not it states any opinions) is for general information purposes only, and does not take into account your personal circumstances or objectives. Nothing in this material is (or should be considered to be) financial, investment or other advice on which reliance should be placed. No opinion given in the material constitutes a recommendation by CMC Markets or the author that any particular investment, security, transaction or investment strategy is suitable for any specific person. The material has not been prepared in accordance with legal requirements designed to promote the independence of investment research. Although we are not specifically prevented from dealing before providing this material, we do not seek to take advantage of the material prior to its dissemination.


