Phishing Alert
Beware of phishing emails or messages directing you to fake CMC Invest login pages designed to capture your credentials. Always access your account by typing cmcmarkets.com directly into your browser or via our official mobile application. Refer to our Fraud Awareness page for further details.
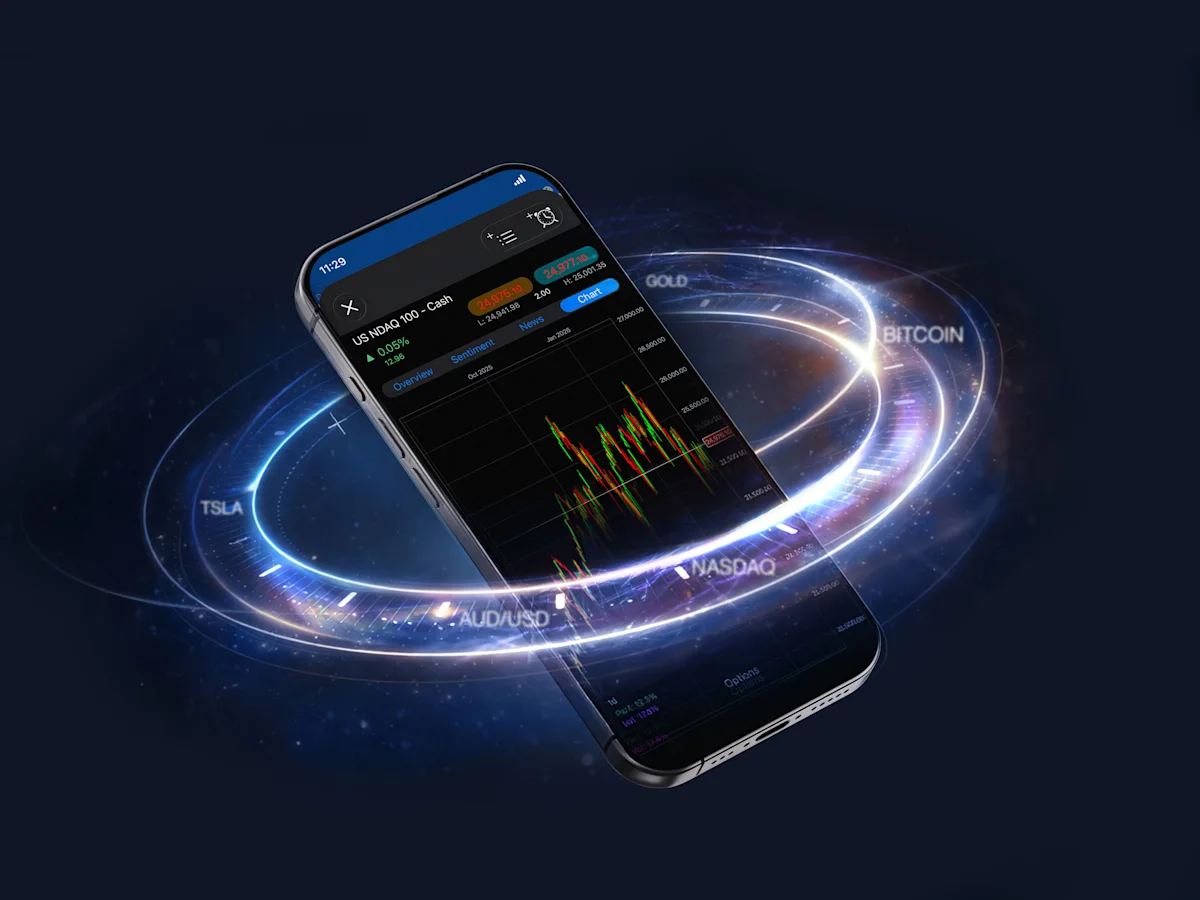
Trade global markets around the clock
Don’t stop when the markets close. Trade CFDs across indices, forex, commodities, shares and crypto, and react to earnings, overnight moves and global market shifts as they happen.
Markets available around the clock:
Crypto: Bitcoin and Ethereum 24/7
Commodities: oil and gold almost 24/5
Forex & indices: global markets almost 24/5
Shares: 5000+ US stocks & ETFs with extended access, almost 24/5
* CMC Markets provides general information only. CFD trading carries significant risks, you do not own underlying assets. Please visit cmcmarkets.com to view the PDS, FSG and TMD for CFDs. CMC Markets Asia Pacific Pty Ltd.
Trade global CFD markets around the clock
+
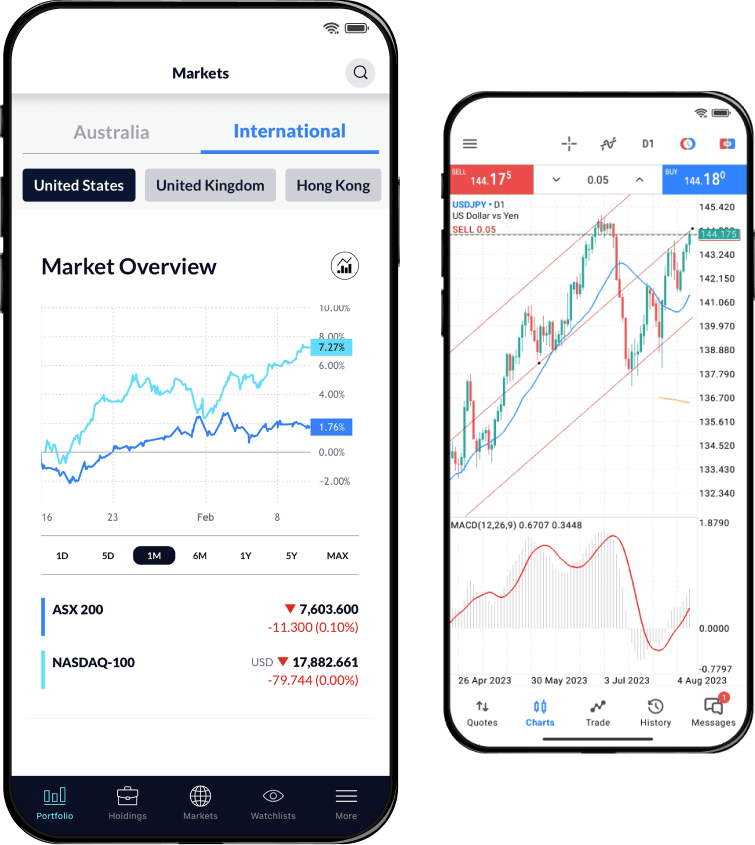
Join 1 million investors powered by an award-winning platform
Discover why we're one of Australia's favourite platforms for share investing and CFD trading. With a world of international stocks and ETFs available to invest in, or trade with leverage on CFDs and Forex.
1,000,000+
clients globally`35+
years' experience40,000+
stocks and ETFs to invest12,000+
global instruments to trade
Diversify your portfolio
Pick your path between CFD and Stockbroking along with 1 million investors.
Start your share investing journey with Australia's favourite non-bank broker. Get access to 40,000+ stocks and ETFs from the ASX and 15 international markets. The choice is yours.
See more
Trade CFDs on more than 12,000 instruments across global markets with confidence. Including Forex, Indices, Commodities, Cryptocurrencies and more.
See more
Why trade with CMC Markets?
- Our focus is you
 We're always looking for ways to improve your trading experience
 - Value for money
 Keep your trading costs down with competitive spreads and low margins
 - Intuitive platforms
 Trade on our user-friendly, custom-built platform and dedicated mobile apps
 - Multiple award-winners
 Over 50 platform and service awards worldwide in the last two years
Elevate your trading with in-depth guidance and insights.
- Share investing knowledge hubLearn Share Investing
From understanding the basics to advanced orders and diversification strategies, learn it all in our knowledge hub. Plus, keep up to date with the latest market insights from our expert analysis panel.
- CFD trading knowledge hubLearn CFD trading
Learn to trade CFDs, understand the risks and advantages of CFD trading, view examples and learn CFD trading strategies.
35+ years of industry experience.
1,000,000+ global clients.

Winner 2023
#1 web platform
ForexBrokers
Winner 2011-2026
Broker of the Year
Canstar
Winner 2024
Best for CFDs & Portfolio Insights
WeMoney
Winner 2024
#1 web platform
Best for Foreign Exchange Trading