The Relative Rotation Graph (RRG) below shows the rotation of major world stock markets measured against the MSCI world index in the week to 8 July.
The big picture remains similar to last week, with most tails in the leading quadrant. However, they are rolling over, indicating that they are losing relative momentum. As they roll over, they are changing direction, with several of these arrowheads now pointing towards the chart’s south west. US markets, including the S&P 500 (SPX) and Nasdaq 100 (NDX), are pointing up, signalling that they are gaining momentum.
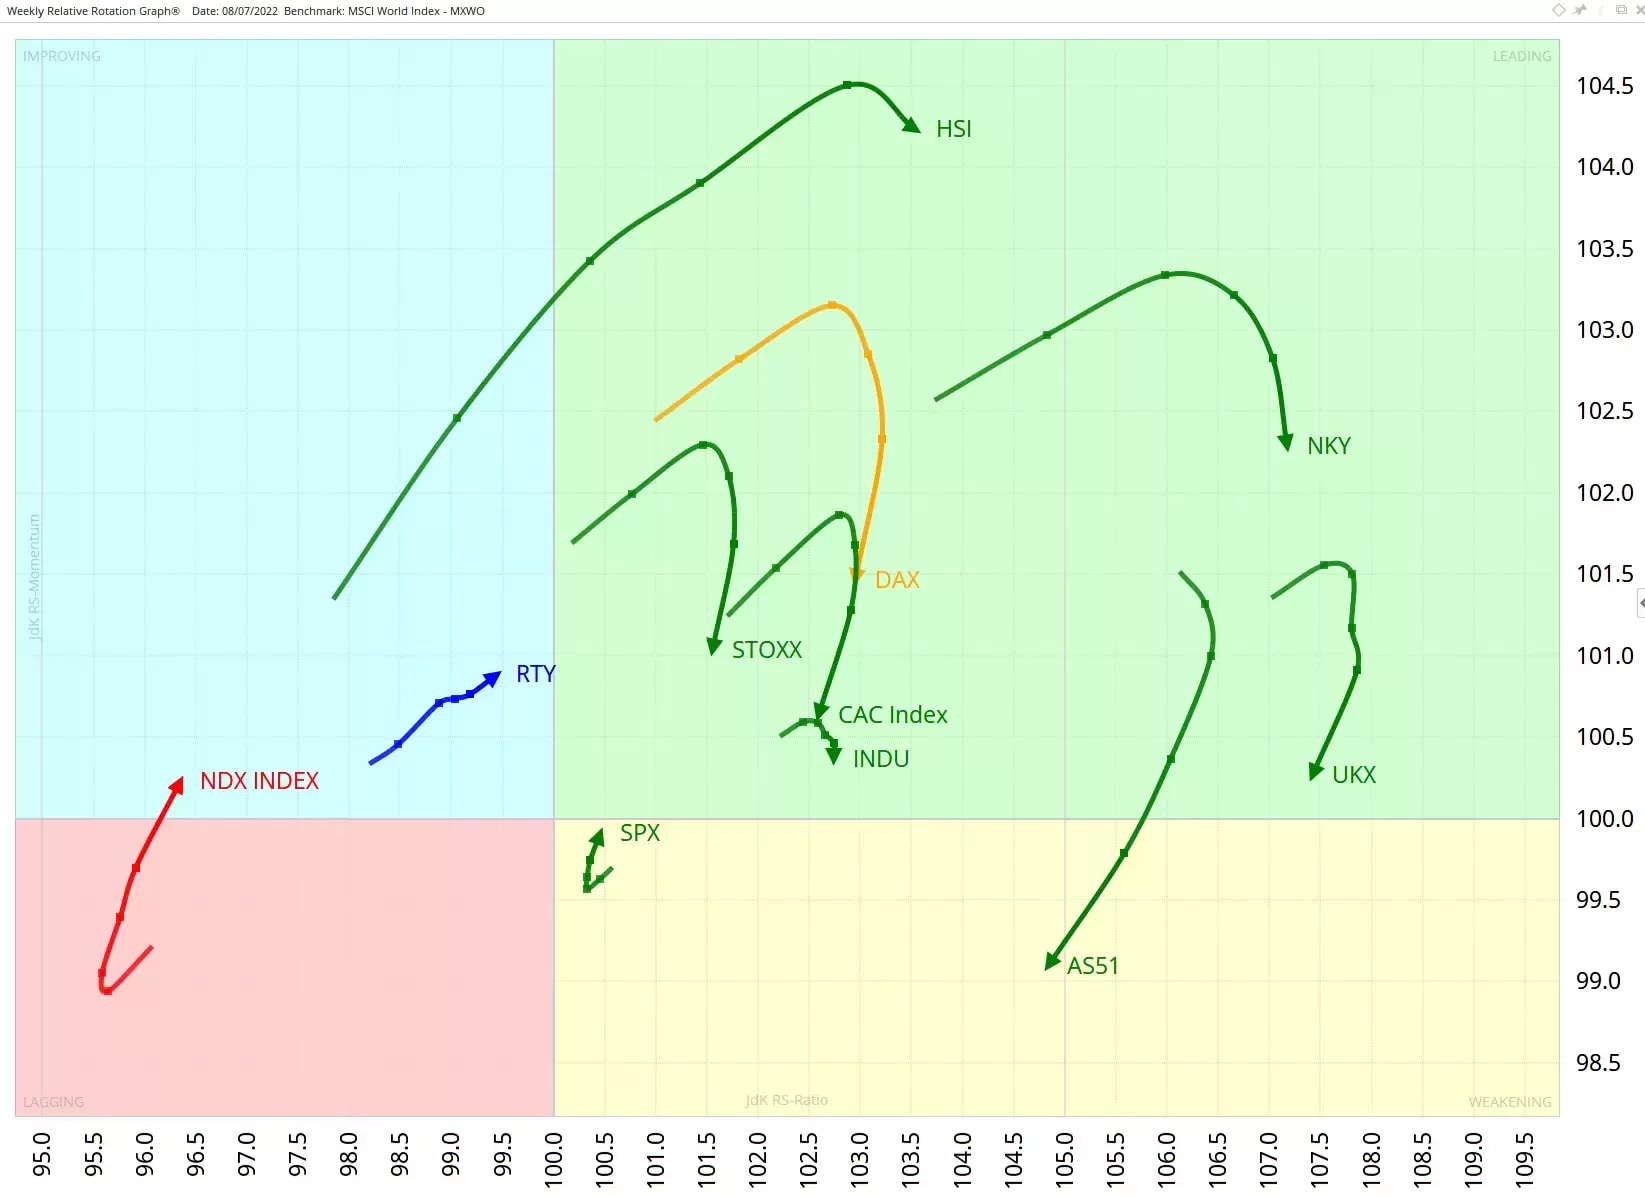
The main takeaway from this chart is that the rest-of-the-world indices remain in a relative uptrend compared to US markets, but the situation could be about to change. We cannot yet answer the key question of whether the changes we’re beginning to see are a temporary deviation from the prevailing long-term trend, or if this is the start of something new. It is still too early to say. But it’s a situation we’ll be monitoring closely.
European markets lagging
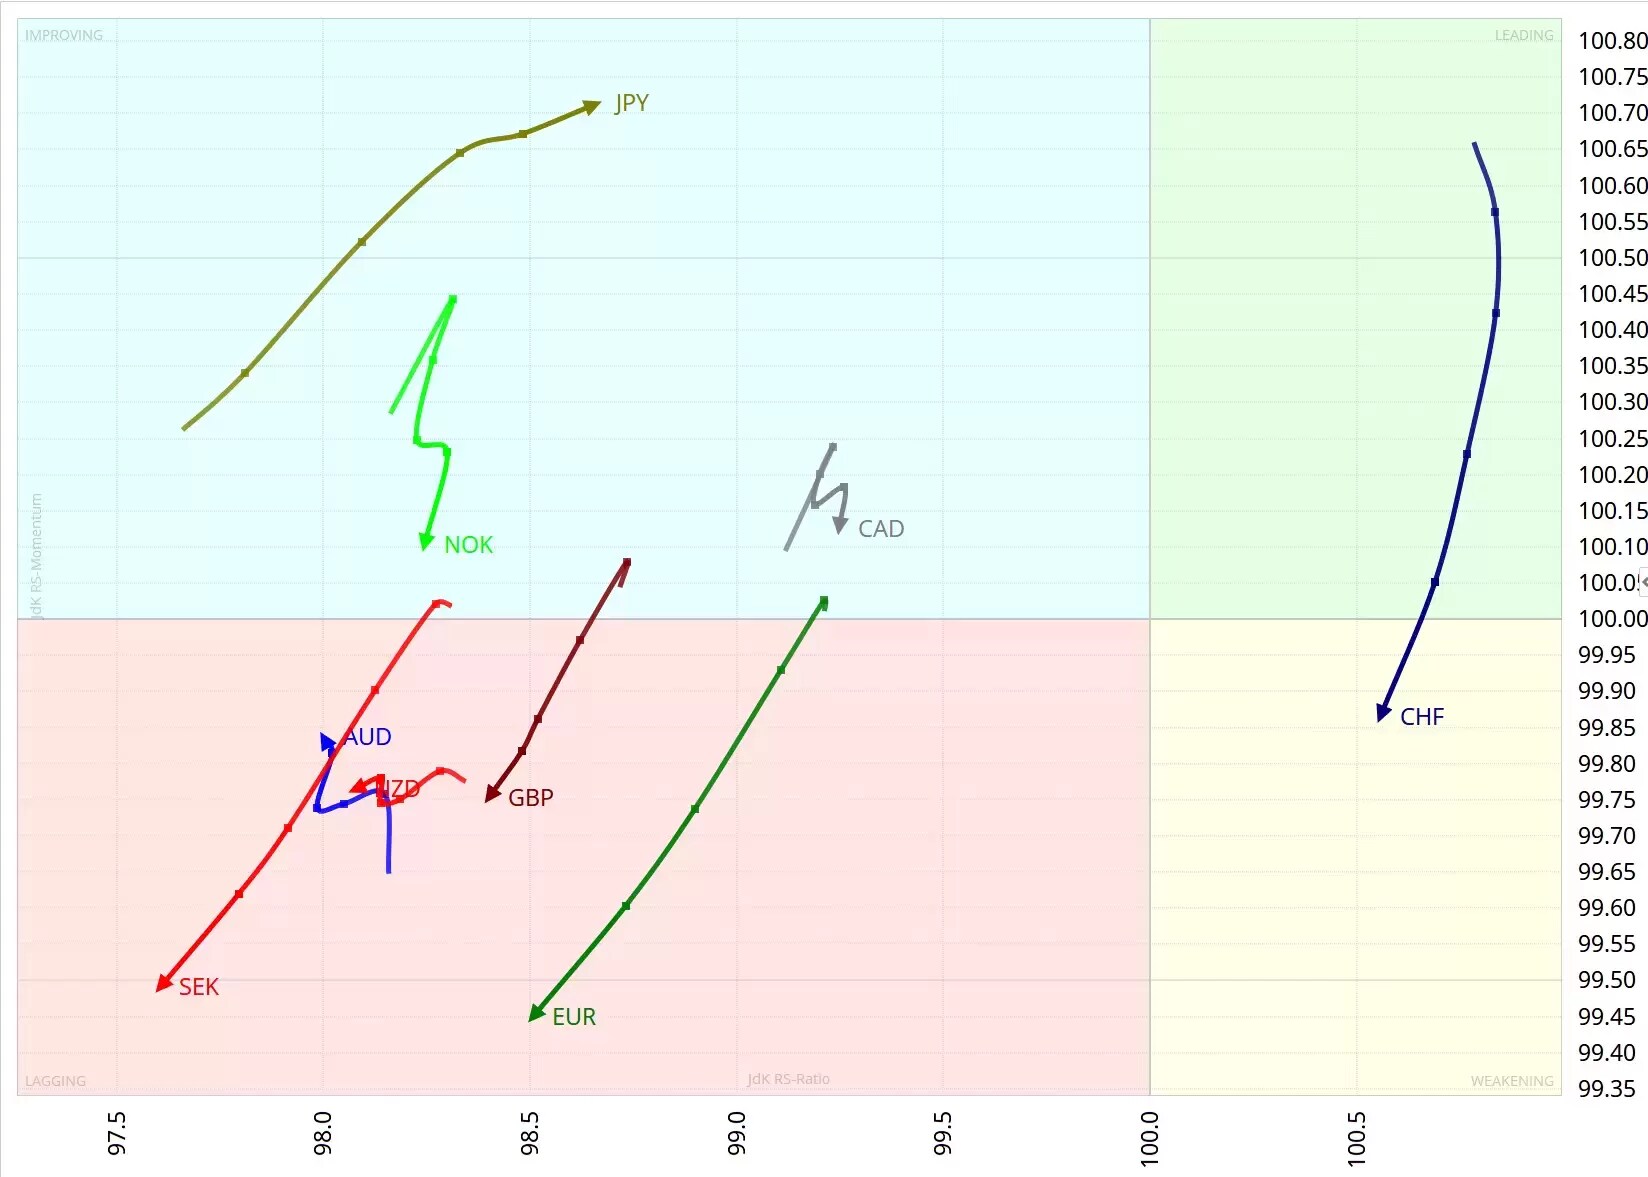
When we drill down to the daily RRG, shown below, we see that non-US markets are losing relative momentum. The leading quadrant is populated by US indices, while in the lagging quadrant we find Germany’s Dax and France’s Cac 40, as well as the pan-European Stoxx.
Last week, Julius drew attention to a bullish divergence in the relative strength of the Russell 2000 (RTY) compared to the Dow Jones Industrial Average (INDU). The Russell 2000 is a broad-based index, containing – as its name suggests – 2000 stocks, while the Dow Jones is made up of 30 prestigious, large-cap companies. The latest data support our view that the broad RTY seems to be catching up with and potentially overtaking the heavyweight INDU.

US dollar still strong
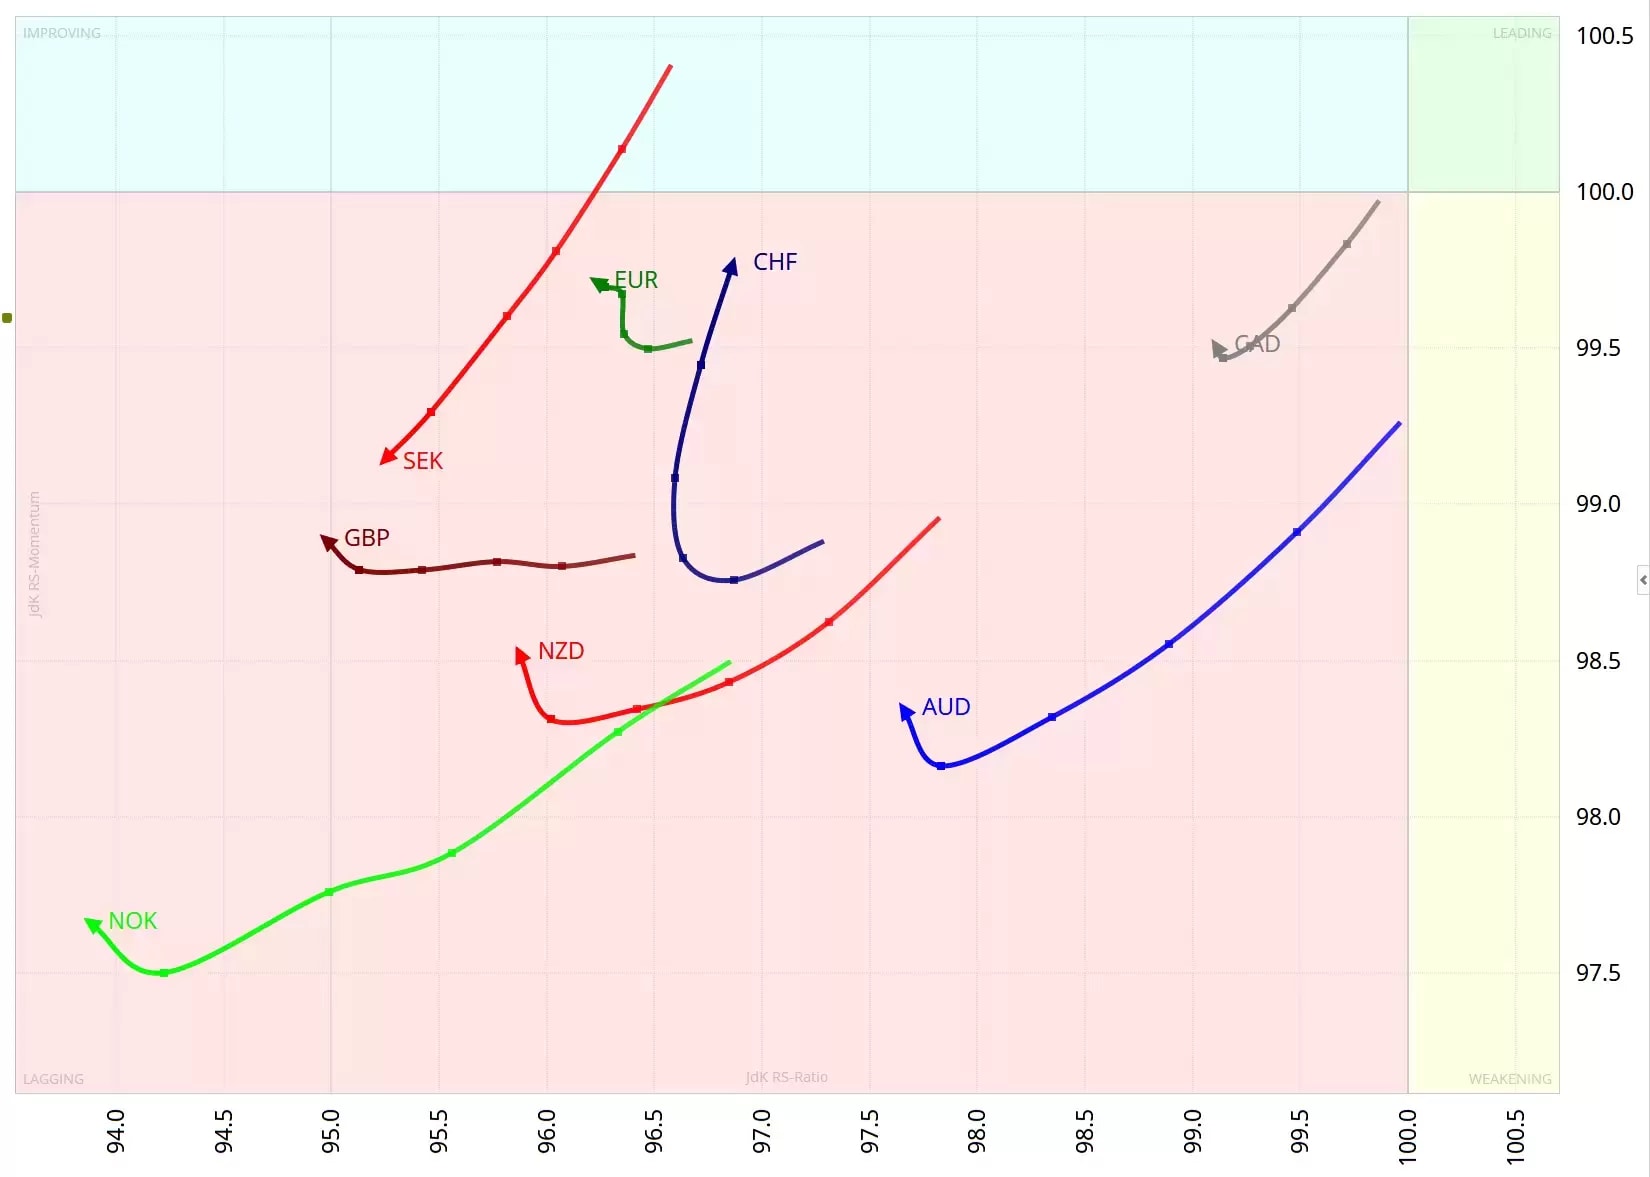
Moving onto currencies, the weekly RRG below again shows the continued strength of the US dollar against the world’s other G10 currencies. All currencies are in the lagging quadrant, with the USD providing the chart’s benchmark. The US dollar is the undisputed king.
Last week, we saw an improvement in the relative momentum of the currencies shown, as important support levels were tested. Now, as the daily RRG below illustrates, some significant support levels have given way. The exception is the Japanese yen, which is in the improving quadrant.
Euro sinks lower
Last week, Julius explained that the EUR/USD currency pair was testing support at the 1.03 area, a critical level going back to 1995. This level had served as support during a few major market turnarounds, most recently in 2015 and 2017.

As the above chart shows, support at 1.03 has gone now, and the euro has plunged against the US dollar. The monthly moving average convergence divergence (MACD) line crossed the signal line earlier this year, but the gap between the two lines is widening, indicating increasing downward momentum. This decisive break lower could open up the way for further USD strength.
So, where next? Euro-dollar parity could act as a magnet. There was a small consolidation at 98 from 2002. Therefore, stiff support comes in at 98. Any bounce from here is likely to hit strong resistance at the 1.03 level.
Pricing is indicative. Past performance is not a reliable indicator of future results.
RRG’s views and findings are their own and should not be relied upon as the basis of a trading or investment decision.
Disclaimer: CMC Markets is an execution-only service provider. The material (whether or not it states any opinions) is for general information purposes only, and does not take into account your personal circumstances or objectives. Nothing in this material is (or should be considered to be) financial, investment or other advice on which reliance should be placed. No opinion given in the material constitutes a recommendation by CMC Markets or the author that any particular investment, security, transaction or investment strategy is suitable for any specific person. The material has not been prepared in accordance with legal requirements designed to promote the independence of investment research. Although we are not specifically prevented from dealing before providing this material, we do not seek to take advantage of the material prior to its dissemination.


