Read on for Michael Kramer's weekly market preview, or watch the video above for RRG Research’s analysis of major share indices.
Welcome to Michael Kramer’s pick of the top three market events to look out for in the week ahead.
It will be a holiday-shortened trading week in the US, with markets closed on Monday 27 May due to Memorial Day. The holiday is well-timed, too, because the first half of the week is expected to be uneventful. All the excitement starts on Wednesday, when Salesforce [NYSE: CRM] reports first-quarter earnings. Then on Friday we could get some market-moving inflation data, with the latest readings of the eurozone’s consumer price index (CPI) and the US personal consumption expenditures (PCE) price index.
Salesforce Q1 results
Wednesday 29 May: Salesforce is expected to report that its fiscal first-quarter revenue grew 10.9% year-on-year to $9.1bn, with earnings increasing 40.6% versus the year-ago period to $2.38 per share. Adjusted gross margin is expected to improve to 79.5%, up from 74.2% a year ago. For the second quarter, analysts estimate that revenue will grow 8.7% to $9.3bn, with earnings up 13.3% at $2.40 per share. Meanwhile, adjusted gross margin in Q2 is expected to be 79.8%.
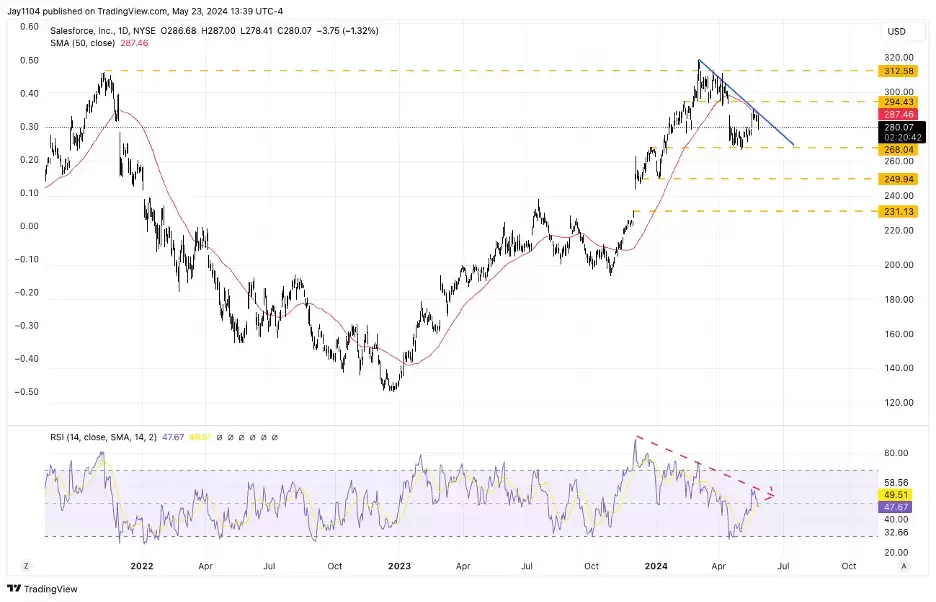
Despite these solid fundamentals, the Dow Jones-listed software company’s share price – up 9% year-to-date at a notch under $280 – has been unable to close above resistance at around $317. This level dates back to the highs of November 2021. After a strong start to the year, the shares have formed a short-term downtrend since reaching a 52-week intraday high of $318.72 on 1 March.
This downtrend, and a support level at $268 that was put in place last December, create what appears to be a descending triangle pattern – a bearish formation – as shown on the technical chart below. If this pattern continues to play out, the next stop for the stock could be around $250, especially since the relative strength index has been trending lower since late November. The 50-day moving average has also been sliding. However, if the stock breaks above the 50-day moving average following the Q1 results, it could fill an upside gap to around $295.
Salesforce share price, 2022-present

Sources: TradingView, Michael Kramer
US April PCE inflation
Friday 31 May: The update on the US PCE price index, reportedly the Federal Reserve’s preferred measure of inflation, will be critical. Even if the April data matches expectations, it won’t make for pretty reading. Headline PCE is expected to be up 0.3% month-on-month and 2.7% year-on-year, with both of those figures unchanged from March. Meanwhile, core PCE – which excludes volatile food and fuel prices – is expected to be up 0.3% m-o-m and 2.8% y-o-y, again in line with March.
Higher-than-expected readings, indicating persistent price pressures, could make it more difficult for the Fed to reduce interest rates in the coming months. Policymakers are therefore likely be hoping for a miss on core PCE, particularly on the monthly number, without any upward revisions to figures for previous months.
The US two-year Treasury yield has moved back up to the 4.95% region in the past week, following a significant decline last week. The PCE reading may well determine where the two-year goes next. A lower-than-expected reading could make the Fed's path to rate cuts more accessible, while an in-line or ‘hot’ number could mean no rate cuts in 2024 and may even put rate rises back on the table. If the two-year ticks above 5%, the next stop could be 5.25% – a signal that rate hikes are becoming a possibility, which wouldn’t be good for any risk assets.
Eurozone May CPI
Friday 31 May: The preliminary eurozone CPI estimate for May is expected to show that consumer prices rose 0.2% month-on-month, down from 0.6% in April, and climbed 2.6% year-on-year, up from 2.4% last month. Meanwhile, core CPI is projected to have risen 2.8% year-on-year, up from 2.7% a month ago. This inflation report matters because the European Central Bank has signalled that it may cut interest rates at its next meeting on 6 June. Swaps markets are pricing in a better than 90% chance that the ECB will cut rates by 25 basis points at the June meeting.
A hotter-than-expected CPI report might cast doubt on the ECB' s plans to proceed with a rate cut. It could create confusion in markets, especially if it is significantly hotter than expected. On the other hand, while a cooler-than-expected report wouldn’t necessarily change the forecast for June, it could bring forward additional ECB rate cuts, which aren’t expected until the second half of 2024.
The euro would be the biggest winner or loser in these scenarios. The technical chart suggests that EUR/USD could move lower in the near term after it failed to break above resistance at around $1.089 on Monday. Now, the euro is supported at $1.08, but a break of support at $1.08 would interrupt an uptrend, potentially sending the euro down to $1.07. Meanwhile, upside resistance is pretty limited at $1.089.
Key economic and company events
Here’s our rundown of notable economic announcements and company reports scheduled for the coming week:
Monday
• Germany: May IFO business climate
• US: Markets closed (Memorial Day)
Tuesday
• Australia: April retail sales
• US: March housing price index, May consumer confidence
• Results: Heico (Q2)
Wednesday
• Australia: April consumer price index (CPI)
• Germany: May CPI
• Results: Agilent Technologies (Q2), HP (Q2), Pets at Home (FY), Salesforce (Q1)
Thursday
• Eurozone: May business climate, May consumer confidence, April unemployment rate
• Japan: May Tokyo CPI
• New Zealand: yearly budget release
• Spain: May CPI
• Switzerland: Q1 gross domestic product (GDP)
• US: Q1 GDP
• Results: Auto Trader (FY), Costco Wholesale (Q3), Dell Technologies (Q1), Dollar General (Q1), Marvell Technology (Q1), Veeva Systems (Q1)
Friday
• Canada: Q1 GDP
• China: May manufacturing and non-manufacturing purchasing managers’ indices
• Eurozone: May CPI
• France: May CPI
• Germany: April retail sales
• Italy: Q1 GDP, May CPI
• US: April personal consumption expenditures (PCE) price index
• Results: Frontline (Q1)
Note: While we check all dates carefully to ensure that they are correct at the time of writing, the above announcements are subject to change.
Index dividend schedule
Dividend payments from an index's constituent shares can affect your trading account. View this week's index dividend schedule.
Disclaimer: CMC Markets is an execution-only service provider. The material (whether or not it states any opinions) is for general information purposes only, and does not take into account your personal circumstances or objectives. Nothing in this material is (or should be considered to be) financial, investment or other advice on which reliance should be placed. No opinion given in the material constitutes a recommendation by CMC Markets or the author that any particular investment, security, transaction or investment strategy is suitable for any specific person. The material has not been prepared in accordance with legal requirements designed to promote the independence of investment research. Although we are not specifically prevented from dealing before providing this material, we do not seek to take advantage of the material prior to its dissemination.


