The US October consumer price index (CPI) report on 10 November could be a big market-moving event. Estimates for this week's report appear low based on forecasts from the Cleveland Federal Reserve. If this turns out to be the case, rates on the front of the Treasury curve could continue to increase, sending the US dollar higher and stock prices lower – setting the stage for a wild end to 2022.
Analysts estimate a year-on-year (y/y) increase of 7.9%, and 0.6% month-on-month (m/m). Meanwhile, core CPI is expected to rise by 6.5% y/y and 0.5% m/m. Currently, the Cleveland Fed sees CPI increasing by 8.1% y/y and 0.8% m/m, while core CPI is forecast to rise 6.6% y/y and by 0.5% m/m. Interestingly, the Cleveland Fed’s headline CPI inflation estimates have been below the actual CPI data in 16 of the last 19 months.
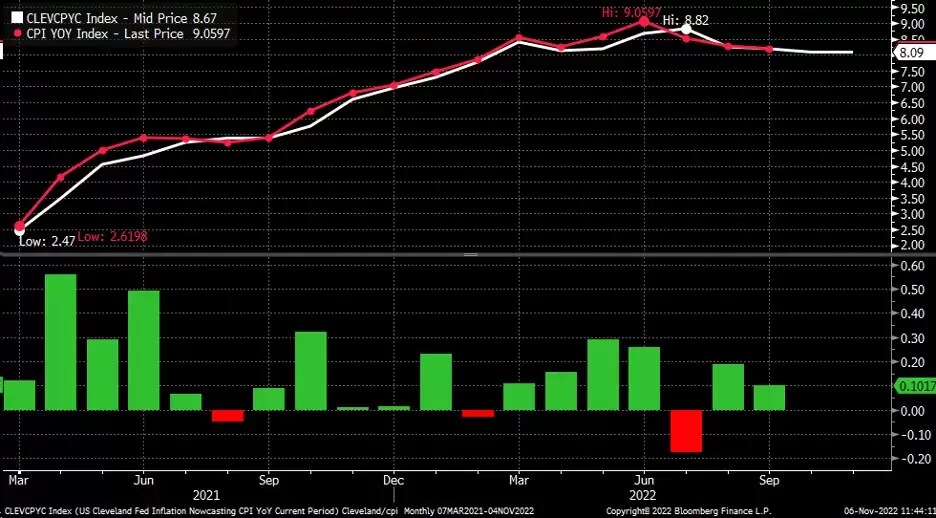
Considering the Cleveland Fed estimates are above Wall Street consensus estimates, and the Cleveland Fed has a history of underestimating CPI, it stands a good chance that headline CPI comes in hotter than expected.
Rates may head even higher
A CPI report that comes in above analysts' consensus estimates of 7.9% would probably be a shocker to markets, and may result in rates and the dollar surging higher, and stock prices dropping as a result. The front of the Treasury curve would be the most vulnerable, as investors may begin to worry about the Fed raising interest rates by another 75 basis points (bps) at the December meeting.
The 2-year Treasury yield appears to have already broken out of a bullish continuation pattern, called a bull flag. A projection of the move higher from 4 October through to 21 October suggests the next leg higher for the 2-year could result in a move up to around 5%.
A stronger dollar
It probably isn't by chance that the dollar has a similar technical setup to the 2-year rate. Higher-than-expected CPI data could push the market to think about an even more aggressive US central bank, and higher yields. In that case, the dollar may strengthen further and follow the 2-year rate higher.
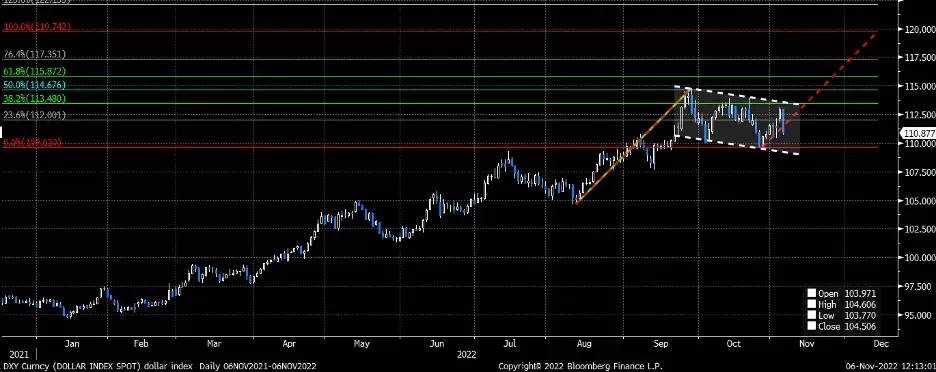
The US Dollar Index also has a very similar bullish flag pattern, but in this case, the dollar's bull flag started back in August and peaked in late September. Since that time, the dollar has been consolidating sideways. An extension of the rally between August and late September could result in the dollar index pushing higher to around 120.
A declining stock market
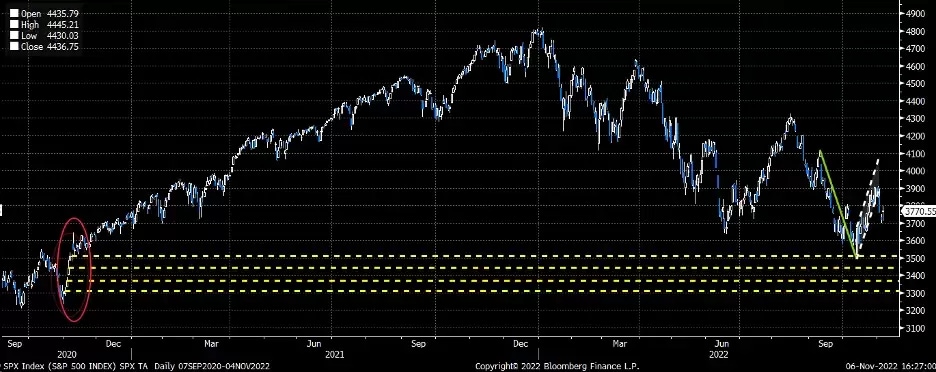
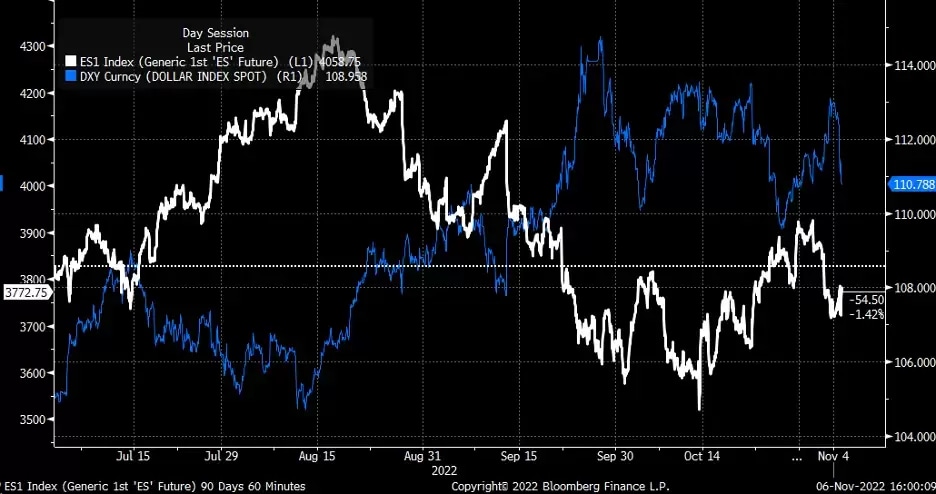
Rising interest rates and a stronger dollar are likely to make the S&P 500 fall. The S&P 500 has been trading inversely to the Dollar Index for several weeks, so it seems apparent that if rising rates result in a strong dollar, the S&P 500 should struggle to advance and, most likely, head lower.
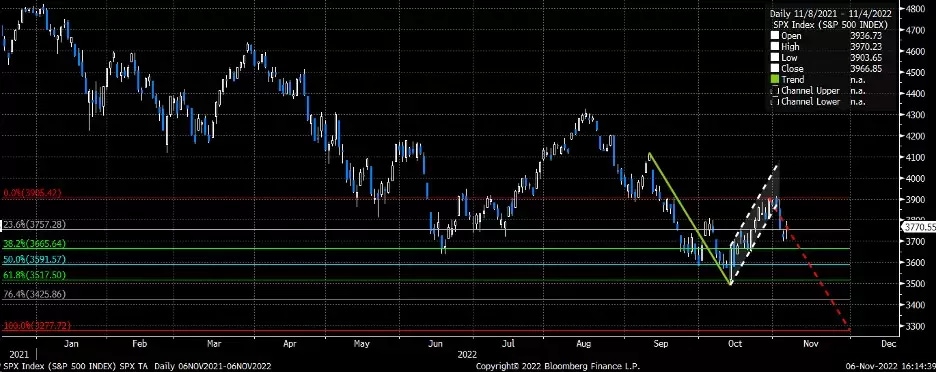
This relationship is why the S&P 500 also has a bear flag in its chart. However, the difference is that it appears the S&P 500 has already broken the rising channel. If the bear flag pattern has already broken down, the S&P 500 could have much further to fall, with the first spot for support around 3,500 and potentially heading to as low as 3,275.
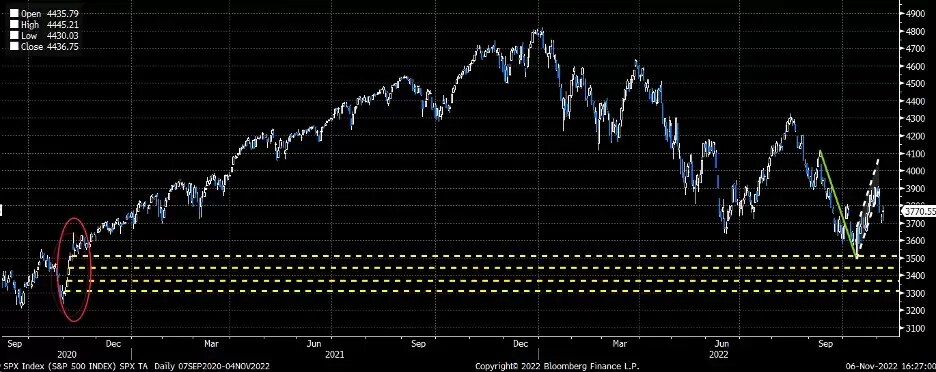
Additionally, if the S&P 500 should break below 3,500, it could open the gate for a decline from a support standpoint. Several significant gaps are unfilled from when the market was moving sharply higher in November 2020, following the new Covid-19 vaccine. It’s not unusual for gaps to be filled over time, and a breakdown below 3,500 could result in those gaps getting filled.
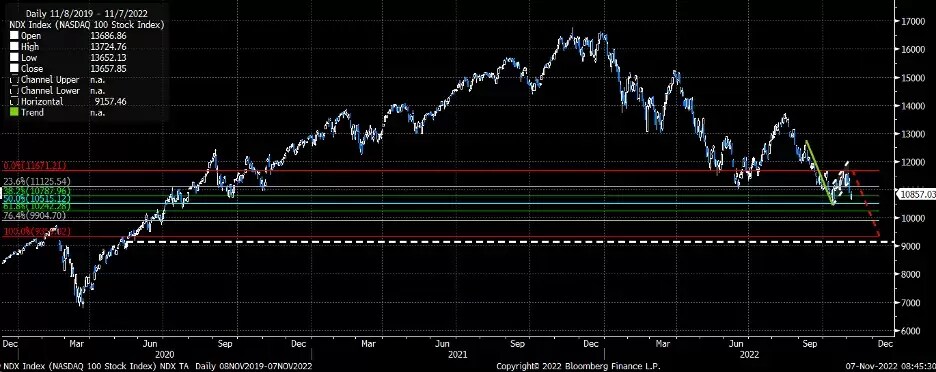
The NASDAQ 100 has the same bear flag as the S&P 500, and the rising channel has also broken. An extension of the bear flag could lead to the NDX dropping to about 9,350. That also brings the index below its pre-Covid highs and, more importantly, very close to the unfilled gap from May 2020, around 9,160, which may also be a support region.
A volatile finish to 2022
An expected, or potentially cooler-than-expected CPI reading, could result in rates and the dollar falling, while stock prices rise dramatically. This makes Thursday's data a win-or-lose event that will either strengthen the case for the Fed to raise rates significantly, or make the case that the Fed should slow the pace of future rate hikes, or potentially pause the process altogether.
At least at this point, the market is positioning itself in a way that suggests inflation comes in hotter-than-expected based on the current technical patterns, which all seem to be continuation patterns. If these patterns turn out to be correct, the last few weeks of 2022 are set to be very volatile.
Charts used with the permission of Bloomberg Finance LP. This report contains independent commentary to be used for informational and educational purposes only. Michael Kramer is a member and investment adviser representative with Mott Capital Management. Mr Kramer is not affiliated with this company and does not serve on the board of any related company that issued this stock. All opinions and analyses presented by Michael Kramer in this analysis or market report are solely Michael Kramer's views. Readers should not treat any opinion, viewpoint, or prediction expressed by Michael Kramer as a specific solicitation or recommendation to buy or sell a particular security or follow a particular strategy. Michael Kramer's analyses are based upon information and independent research that he considers reliable, but neither Michael Kramer nor Mott Capital Management guarantees its completeness or accuracy, and it should not be relied upon as such. Michael Kramer is not under any obligation to update or correct any information presented in his analyses. Mr. Kramer's statements, guidance, and opinions are subject to change without notice. Past performance is not indicative of future results. Past performance of an index is not an indication or guarantee of future results. It is not possible to invest directly in an index. Exposure to an asset class represented by an index may be available through investable instruments based on that index. Neither Michael Kramer nor Mott Capital Management guarantees any specific outcome or profit. You should know the real risk of loss in following any strategy or investment commentary presented in this analysis. Strategies or investments discussed may fluctuate in price or value. Investments or strategies mentioned in this analysis may not be suitable for you. This material does not consider your particular investment objectives, financial situation, or needs and is not intended as a recommendation appropriate for you. You must make an independent decision regarding investments or strategies in this analysis. Upon request, the advisor will provide a list of all recommendations made during the past 12 months. Before acting on information in this analysis, you should consider whether it is suitable for your circumstances and strongly consider seeking advice from your own financial or investment adviser to determine the suitability of any investment. Michael Kramer and Mott Capital received compensation for this article.
Disclaimer: CMC Markets is an execution-only service provider. The material (whether or not it states any opinions) is for general information purposes only, and does not take into account your personal circumstances or objectives. Nothing in this material is (or should be considered to be) financial, investment or other advice on which reliance should be placed. No opinion given in the material constitutes a recommendation by CMC Markets or the author that any particular investment, security, transaction or investment strategy is suitable for any specific person. The material has not been prepared in accordance with legal requirements designed to promote the independence of investment research. Although we are not specifically prevented from dealing before providing this material, we do not seek to take advantage of the material prior to its dissemination.


