One of the main questions for UK investors over the last 20 or so years has been this: why has the FTSE 100 failed to perform well relative to its peers? It has consistently been one of the few global indices that has struggled to make a new record high in the last two years.
We thought we had finally cracked it back in 2015, when a sequence of new record peaks pushed the blue-chip index above 6,950 – the highs back in 2000 – with the most recent record set all the way back in May 2018 at 7,903.40.
Since then, we’ve tried several times to move back to those 2018 peaks, with the most recent peak set in January 2020 at 7,689, and while it was almost matched in February 2022, at 7,687, that rebound only came about after a plunge down to the 4,899 level on 16 March 2020, after governments hit the stop button on the global economy, as the coronavirus pandemic swept across the globe.
The recovery from the 2020 lows ran out of steam earlier this year at 7,687, and the index has since then traded in a broad range with decent support around the 7,000 level, apart from a brief dip down to the 6,700 level during Q3 and the late summer months. Since those Q3 lows there's been a fairly solid rebound, but we’re still well short of the highs this year let alone the record highs set back in 2018.
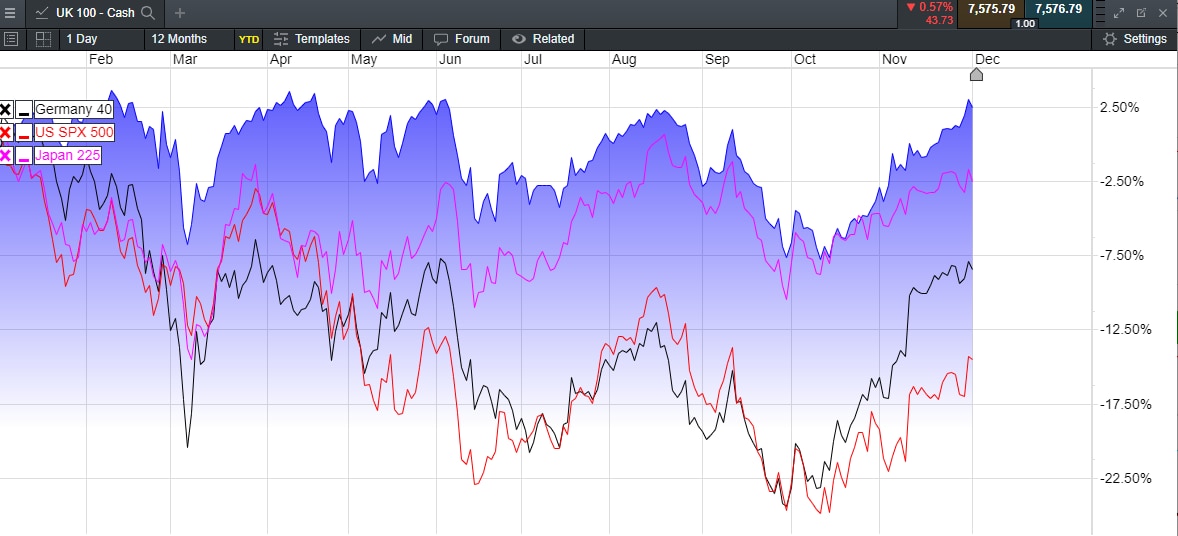
While the performance of the FTSE 100 has been disappointing this year, it has still performed much better than its peers, the German DAX, S&P 500 and the Nikkei 225, as can be seen from the chart below
FTSE 100 outperforms in 2022
Source: CMC Markets
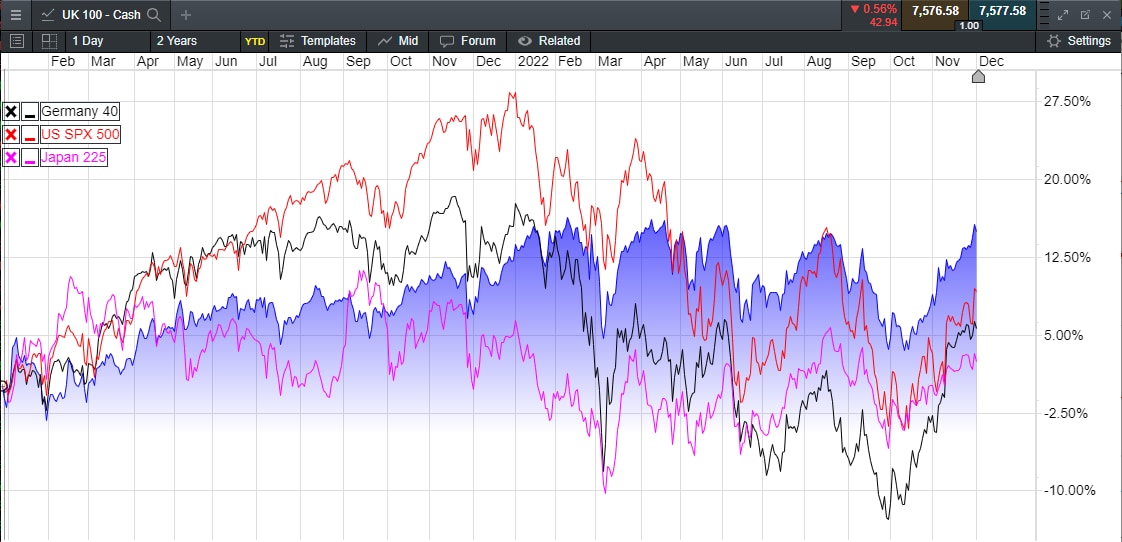
On a two-year timeline the FTSE 100 has also performed well, although it’s been a performance of 'steady as she goes', compared to the peaks and troughs of the S&P 500 and the DAX.
FTSE 100's steady performance 2021- 2022
Source: CMC Markets
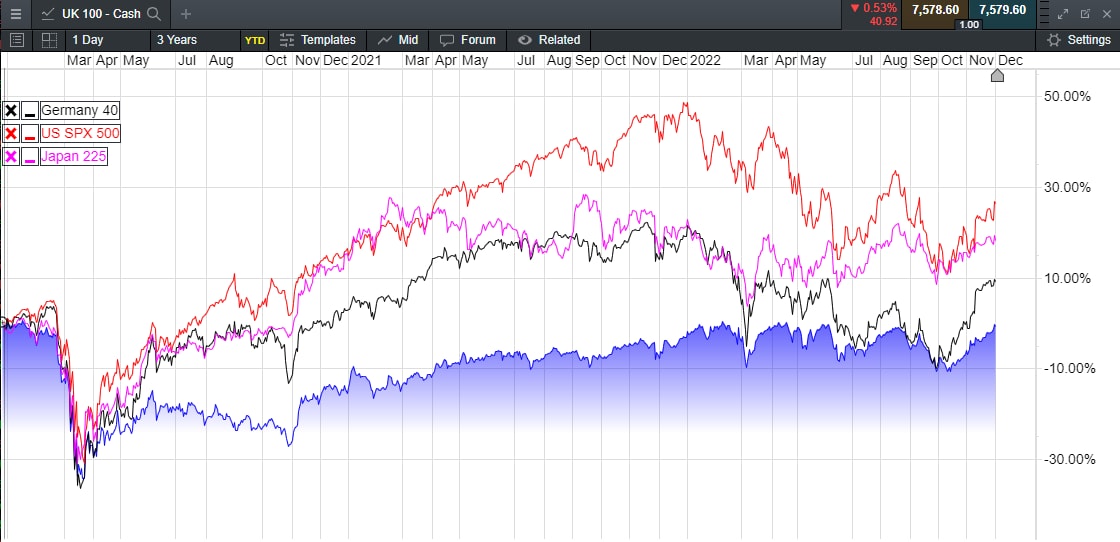
That is still small comfort, however, when looked at on a longer timeline. While the FTSE 100 has outperformed this year, it’s still underperformed from pre-Covid levels and the beginning of 2020, as can be seen from the comparison chart below.
FTSE 100 underperformance since 2020
Source: CMC Markets
The FTSE 100 is still below the levels it finished at the end of 2019, in contrast to its peers of the DAX, S&P 500, and Japanese Nikkei 225, with the S&P 500 and Nikkei still well above their pre-Covid levels.
There are a number of reasons for those indices' outperformance, which can be explained in different ways. Starting with the S&P 500, we’ve seen a huge number of US companies buy back their own shares in response to various tax changes brought about by the Trump administration, which in turn has helped to boost valuations. This has been a consistent theme among US companies since 2016, while the German DAX is a total return index, which includes dividend reinvestment.
If we looked at the FTSE 100 as a total return index like the DAX, we would also have seen record highs this year, and unlike the DAX, have continued to make new record highs, due to the FTSE 100’s more defensive nature. This year’s best performers have been the likes of BP, Shell, and BAE Systems, as well as the more traditional defensive sectors of tobacco and pharmaceuticals. Unsurprisingly, in a year that has seen interest rates rise sharply, UK housebuilders have taken a beating for the second year in a row, with the likes of Persimmon, Barratt Developments, and Taylor Wimpey seeing losses up to 40%.
The big question now as we look back at two successive months of strong gains for the FTSE 100, and other equity markets, is whether this is a bear market rally, or the beginning of a move to new highs. With another 50bps of rate hikes from the likes of the Federal Reserve, European Central Bank, and Bank of England at their respective December meetings, we have to consider a number of unknowns in terms of what is likely to play out in 2023. The first of which is how many more rate hikes are likely to follow in 2023, and how long rates will need to stay at current levels before inflation starts to fall back to the inflation targets of 2%.
This will very much depend on the extent of any downturn and how quickly unemployment starts to rise sharply. While the UK and Europe are probably already in a recession of sorts, it can’t be too long before the US follows suit, while we can’t ignore events in China as they look to move beyond their zero-Covid policy, and look to reopen sometime towards the end of Q1. Inflation is already falling sharply from the peaks seen in the summer, while we’re also seeing big falls in container freight markets with sharp declines in shipping rates.
The Drewry’s composite world container index fell for the 40th week in a row last week and is over 70% down on the same period last year, indicating an easing in global supply chain pressures, although it is still well above pre-pandemic levels. Whether this is due to overcapacity, or simply a symptom of slowing global trade, the net effect is the same: less inflationary pressure, which in time be reflected in weaker producer and factory gate prices, although energy prices are likely to remain highly volatile over the winter period.
That means we could well see the FTSE 100 look to retest the highs of this year in the coming weeks, before it and other equity markets face their biggest test as we head into 2023.
Disclaimer: CMC Markets is an execution-only service provider. The material (whether or not it states any opinions) is for general information purposes only, and does not take into account your personal circumstances or objectives. Nothing in this material is (or should be considered to be) financial, investment or other advice on which reliance should be placed. No opinion given in the material constitutes a recommendation by CMC Markets or the author that any particular investment, security, transaction or investment strategy is suitable for any specific person. The material has not been prepared in accordance with legal requirements designed to promote the independence of investment research. Although we are not specifically prevented from dealing before providing this material, we do not seek to take advantage of the material prior to its dissemination.


