The S&P 500 has been trading choppily as key stocks including Google parent company Alphabet [GOOGL], Nvidia [NVDA] and Tesla [TSLA] pull back. Gary Morrow, the president of Yosemite Asset Management, highlights the key levels to watch in the near term.
S&P 500 treads water
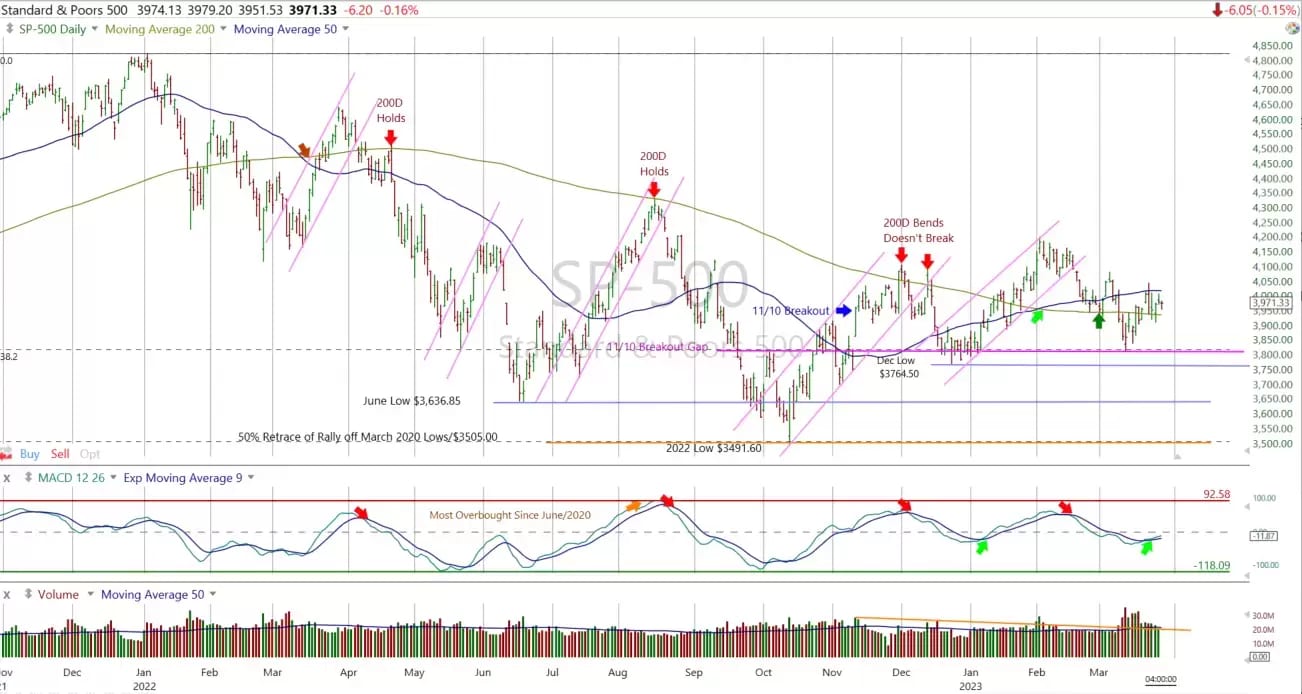
After a period of choppy trading action, the S&P 500 is treading water in a narrow range between its 50- and 200-day moving averages (DMA) as it gets set to post a second consecutive higher weekly low.
As I mentioned in my previous post on 15 March, the index held a key support zone at the March lows. This area remains key in the near term. A close below 3,800 points would violate the March lows, signalling that a deeper and more prolonged pullback may be imminent.
On the upside, an important hurdle for the S&P 500 is the 4,040 area – last week’s high. The index hit this level on 22 March during a downside reversal. Until this area is cleared, more sideways action seems likely.
That said, the index remains in a fairly positive position. The golden cross, a bullish breakout pattern that occurs when the 50-DMA crosses above the 200-DMA, is still intact. Furthermore, the daily moving average convergence/divergence (MACD) indicator, a momentum gauge, is turning up.
Alphabet faces hurdle at $107
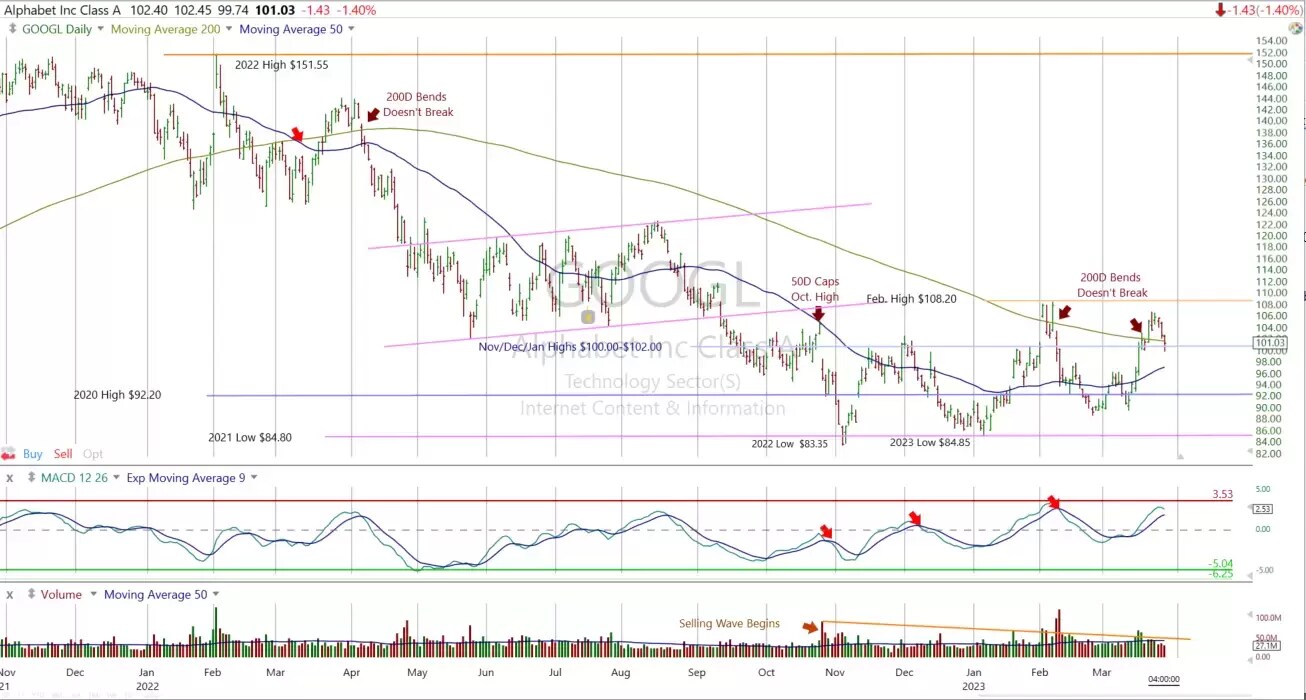
Shares of Google owner Alphabet have pulled back since reaching a fresh March high last week. The rally briefly sent GOOGL above its 200-DMA. The shares pushed above this key long-term indicator in March 2022 and February 2023, before doing so again this month, but each time the stock has been unable to build lasting upwards momentum.
On Tuesday the stock rebounded off a key support area near $100 that was formed by the highs in November, December and January. A base here could limit the current pullback. It’s notable that selling pressure has been very light of late.
On the upside, a key hurdle for GOOGL is the $107 area. If the stock can rise above this resistance level, it could go past the March highs and break free of the 200-DMA. For now, though, more sideways action appears likely.
Nvidia trending higher
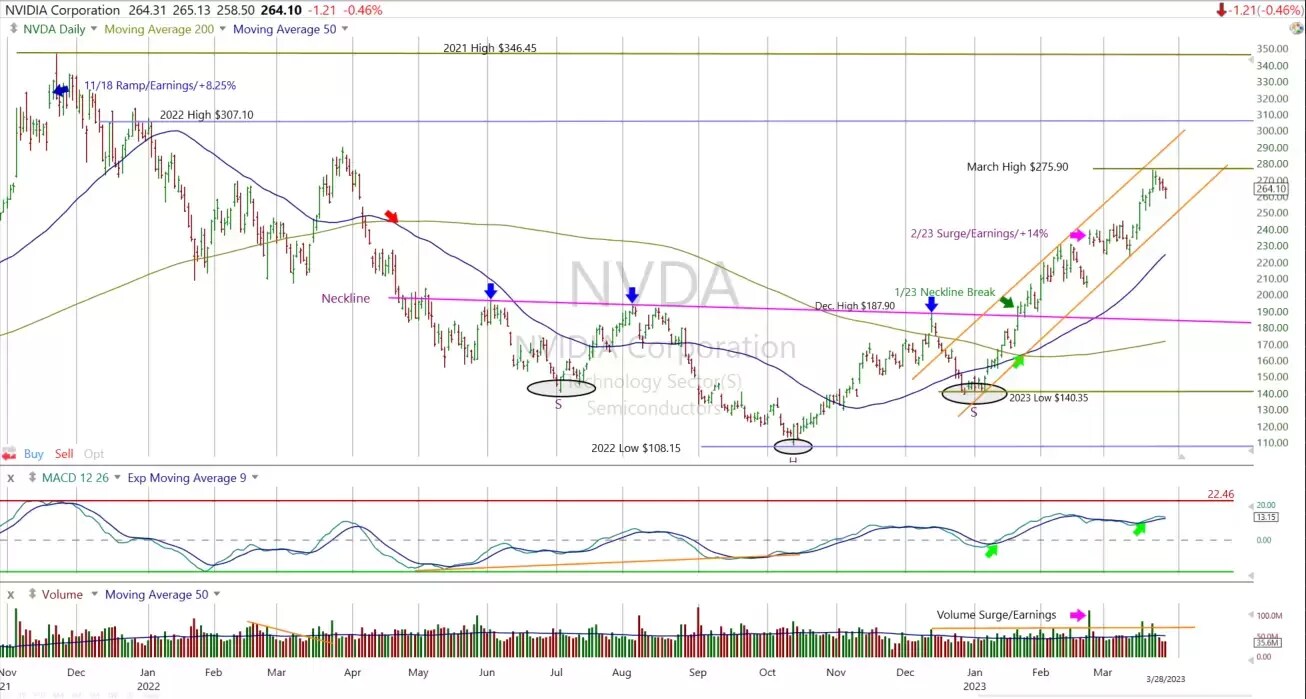
Shares of Nvidia continue to track higher in a narrow bull channel. This powerful trend has seen the stock rise more than 80% year-to-date. Although upside momentum appears to be easing a bit, the rally off the major head and shoulders bottom remains intact.
Shares in the technology company began 2023 with a nine-week winning streak. Heading into this week, the stock had had only one negative week all year. Despite this strong sequence, the daily MACD indicator has remained well below overbought levels.
That said, it would not be a surprise if the stock continues to pull back slightly this week, as it did before the company’s fourth-quarter results were released on 22 February. A close below last week's low of $251, set on 20 March, could signal that a deeper and more prolonged pullback is underway. The area between $238 and $239 appears to be a key support zone as it includes both the February high and the post-earnings spike of 23 February.
Tesla finds support at $162
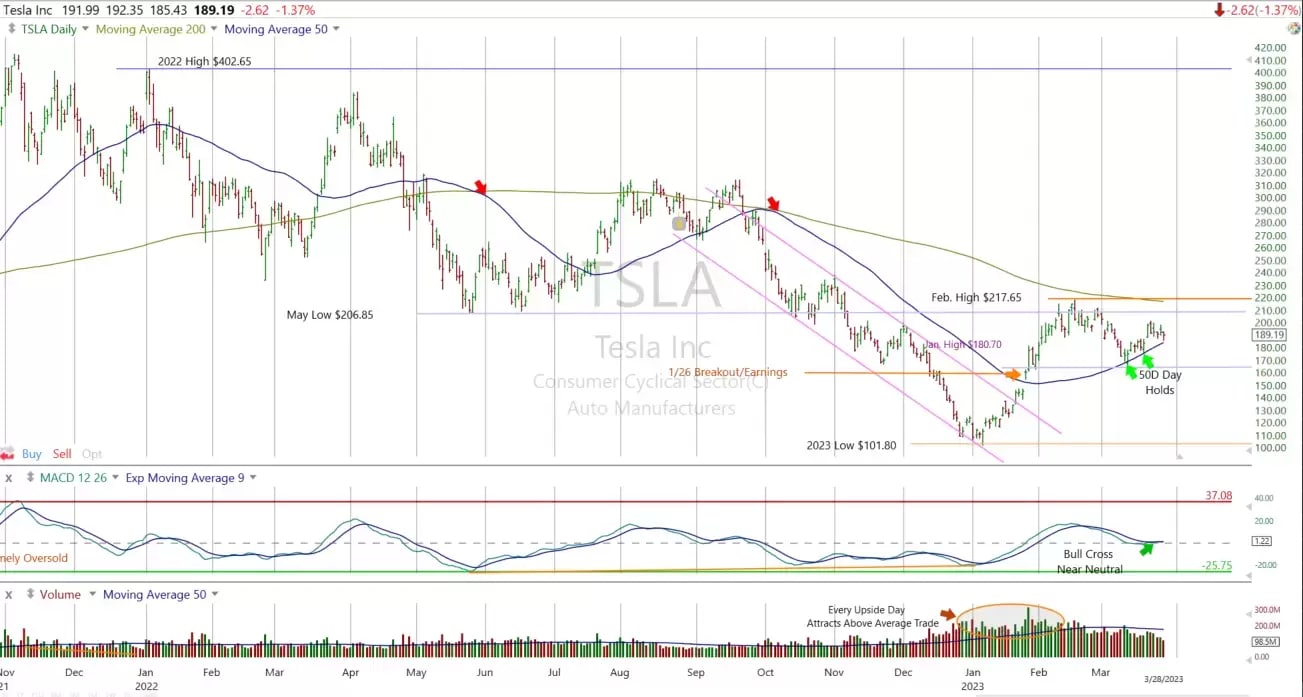
Tesla's pullback from its February peak has been quite orderly. The share price doubled from its January low, reaching a year-to-date high of $217.65 on 16 February. However, the stock had retraced nearly half of this gain by 13 March as it sank back down to a key support level near $162, where it met the stock's upward sloping 50-DMA. Here, the stock posted back-to-back weekly lows. Tesla's January high also sits at this $162 area. On 26 January, the shares surged 11% after Tesla’s Q4 earnings release the night before.
Tesla stock appears far from overbought based on its MACD reading, which has returned to a neutral setting since the shares’ early March pullback. The current MACD reading suggests that the shares would have to rally considerably before reaching an overbought level.
The 200-DMA could provide a challenge for the stock. Last August and September, the shares looked ready to overtake the 200-DMA at around $300. Since then, the 200-DMA has declined to around $216.
On the downside, a close below the 50-DMA could represent a warning sign. This wouldn't necessarily end the rally off the January lows, but a retest of the $162 area could become a possibility.
Disclaimer: The source of the charts used in this report is TC2000, a stock screener and charting tool. This report contains independent commentary to be used for informational and educational purposes only. Gary Morrow is an investment adviser representative with LifePro Asset Management, LLC. Mr. Morrow is not affiliated with this company and does not serve on the board of any related company that issued this stock. All opinions and analyses presented by Gary Morrow in this analysis or market report are solely Gary Morrow’s views. Readers should not treat any opinion, viewpoint, or prediction expressed by Gary Morrow as a specific solicitation or recommendation to buy or sell a particular security or follow a particular strategy. Gary Morrow's analyses are based upon information and independent research that he considers reliable, but neither Gary Morrow nor LifePro Asset Management guarantees its completeness or accuracy, and it should not be relied upon as such. Gary Morrow is not under any obligation to update or correct any information presented in his analyses. Gary Morrow's statements, guidance, and opinions are subject to change without notice. Past performance is not indicative of future results. Past performance of an index is not an indication or guarantee of future results. It is not possible to invest directly in an index. Exposure to an asset class represented by an index may be available through investable instruments based on that index. Neither Gary Morrow nor LifePro Asset Management guarantees any specific outcome or profit. You should know the real risk of loss in following any strategy or investment commentary presented in this analysis. Strategies or investments discussed may fluctuate in price or value. Investments or strategies mentioned in this analysis may not be suitable for you. This material does not consider your particular investment objectives, financial situation, or needs and is not intended as a recommendation appropriate for you. You must make an independent decision regarding investments or strategies in this analysis. Upon request, the adviser will provide a list of all recommendations made during the past 12 months. Before acting on information in this analysis, you should consider whether it is suitable for your circumstances and strongly consider seeking advice from your own financial or investment adviser to determine the suitability of any investment. Gary Morrow received compensation for this article.


