The crude oil markets rose for the third consecutive month in September on improved demand outlooks and expectations for OPEC + to keep supply tight by cutting production further. The WTI futures jumped 21%, and the Brent futures rose 26% in the past three months. However, both benchmark prices fell three days in the past four trading days, making traders doubtful about whether the oil market can re-claim the $100 per barrel. The 100-mark might be achievable, given the increasing demand and reduced supply by OPEC + in the past few months. However, crude prices might not be able to sustain above the level due to global economic uncertainties.
Supply and demand hang in the balance
On the supply side, the International Energy Agency(IEA)’s report showed that OPEC+’s output reduction took the cartel’s oil production to 50 million barrels per day (bpd) in July to nearly a two-year low as the leader of the organization, Saudi Arabia, voluntarily cut production by an extra 1 million barrels per day and may extend the reduction to the end of 2023. The organization’s output sharply declined by 2 mb/d from January this year. At the same time, non-OPEC producers ramped up their production by 310 kb/d to 50.2 mb/d, which may take the global oil output to hit a record of 101.5 mb/d in 2023. The US oil production is the biggest contributor to the increase. At the same time, the cartel’s supply had hit a bottom in July and rose for the second consecutive month in September. The monthly Reuters survey showed that production increased by 120,000 bpd due to higher output in Iran and Nigeria in August, with Iran’s production hitting a new 2018 high of 3.15 million bpd. The OPEC oil production had risen for the first time since February.
On the demand side, the US commercial crude oil stockpiles decreased by 2.2 million barrels by the week ending 22 September from the previous week. The crude imports increased by 8.2% on average over the past four weeks from the same period last year. The latest IEA’s report shows that global oil demand “is set to expand by 2.2 million barrels per day (mb/d) to 102.2 mb/d in 2023, with China accounting for more than 70% of growth. In June and August, global oil demand hit a record of 103 mb/d as major economies had faster growth than forecast in the second quarter. China’s improvement in its recent economic data has also fuelled the oil market’s rally. However, the momentum may not be sustained in 2024 as the US Fed’s rate hikes and China’s economic slowdown may dampen demands globally. Also, the increase in electric vehicles will weigh on fuel demands. The IEA expects the global demand will slow to 1 mb/d in 2024.
Technical analysis
WTI (Cash)- topping out

WTI fell below the 50-day moving average for the first time since July, suggesting the upside trend may have ended. The potential imminent support can be found at about 80. A breakdown below this level can take its price to approach the year-low of 67. However, the RSI is moving towards an oversold territory, suggesting a near-term rebound may be expected.
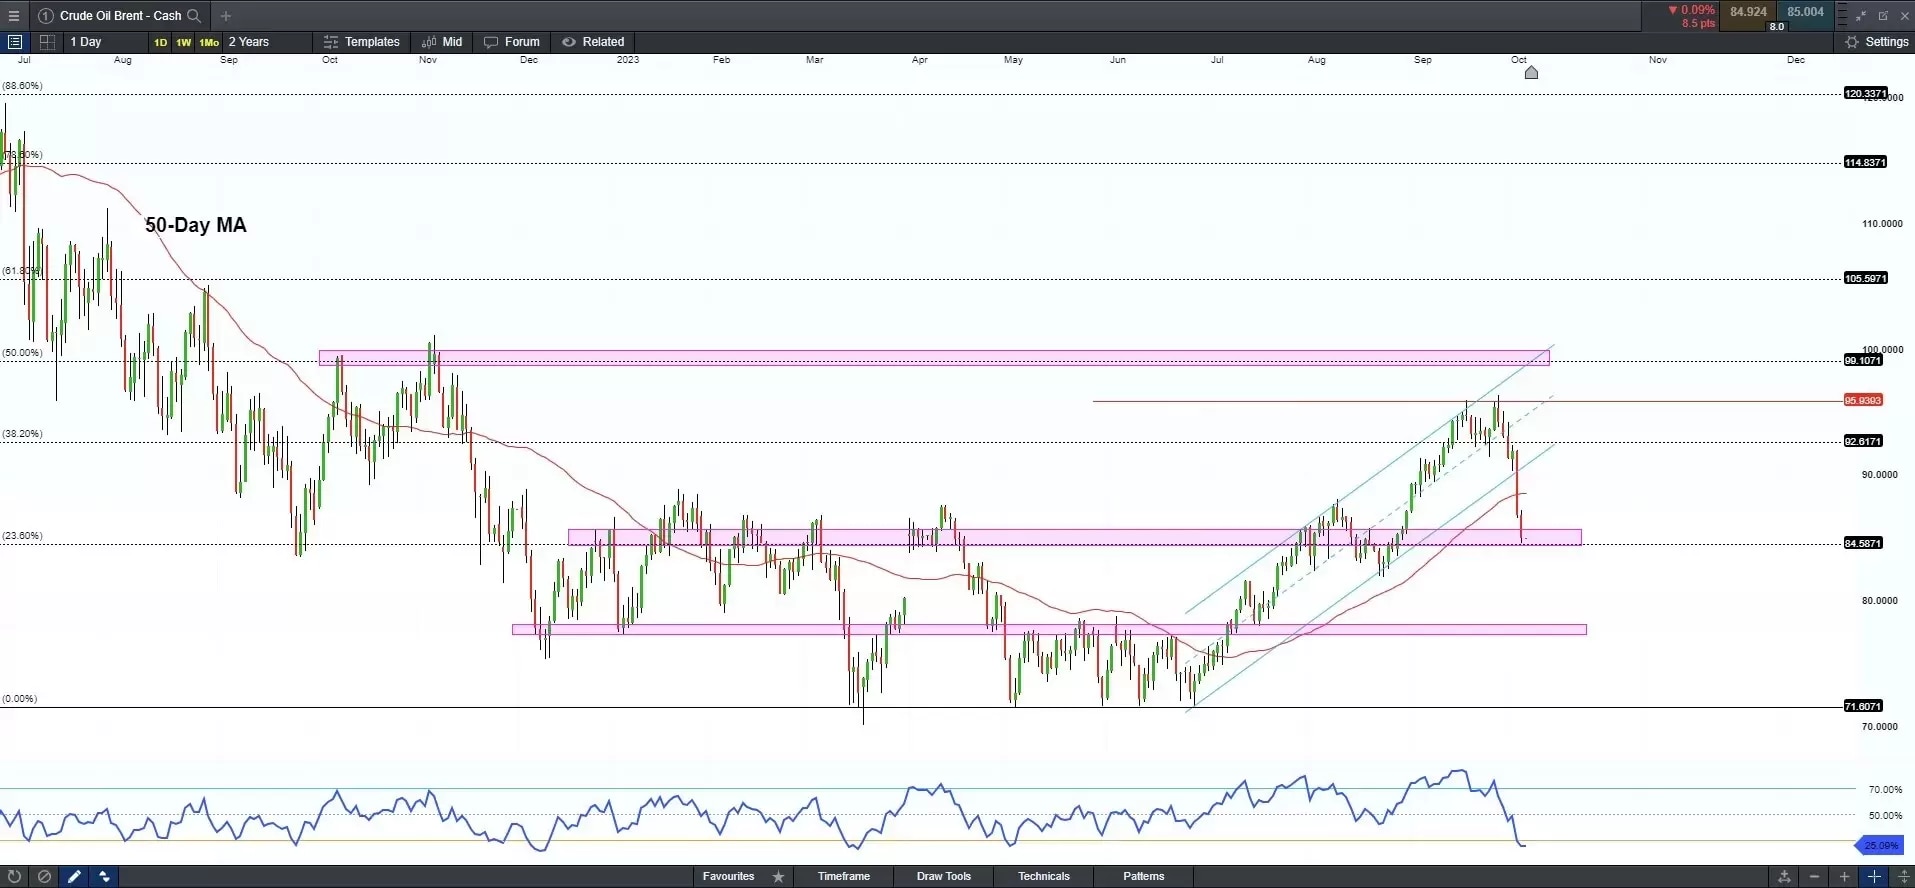
Brent (Cash) – testing key support

Brent oil has a similar pattern with WTI, but the price has already fallen into key support of between 84 and 85, with RSI entering an oversold territory. While a near-term rebound is expected, a breakdown below this level could take Brent to further support of between 76 and 78.


