Bond prices collapsed this year as central banks aggressively increased interest rates in a bid to battle inflation.
Where bond prices go in 2023 will primarily be determined by how much the global economy slows and how “sticky” inflation proves to be. If inflation takes a while to come down, interest rates may need to rise from current levels.
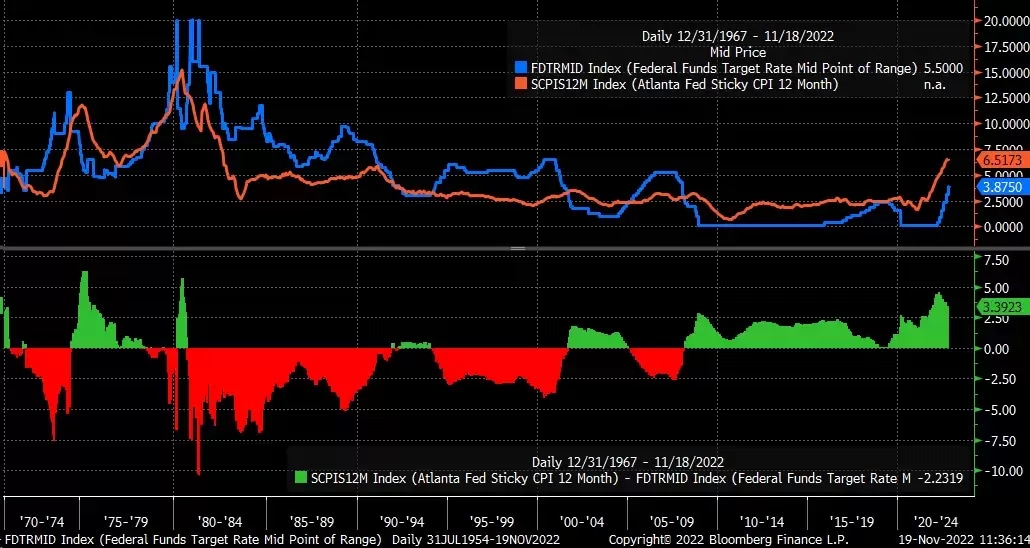
The Federal Reserve Bank of Atlanta measures the “stickiness” of inflation through its 12-month sticky-price consumer price index (CPI) – a weighted basket of items that tend to change price slowly. This measure of inflation is running at 6.51%, the highest level since 1982.
Historical data show that only after the effective federal funds rate has surpassed the sticky inflation rate, as happened in 1980, do we see downward pressure on interest rates. Based on the current effective funds rate of 3.83%, interest would still need to rise by 2.68% to reach the 6.51% sticky inflation rate.
Overnight rates could move above 5%
Given the high sticky inflation rate, it seems unlikely that the US Federal Reserve has finished raising interest rates. This view is supported by the fact that Fed governors are talking about raising the overnight rate to between 5% and 5.25% in 2023.
The longer that the so-called sticky inflation remains at its current level, the higher that overnight rate will have to go to bring inflation down.
A 5.25% overnight rate suggests that the two-year treasury rate needs to rise above its current level of 4.48% to around 5%. This rate has been tracking the December 2023 Fed Funds Futures contract and currently trades at a 17-basis-point discount to the December contract.
However, if the Fed intends to keep rates steady after they reach the terminal rate, a 5.25% December 2023 overnight rate looks probable. The Federal Open Market Committee may offer commentary on this point at its December meeting – look out for the Summary of Economic Projections which the Fed publishes online.
If the Fed wants to drive the point home that rates will be elevated for some time, it could mean a 5% to 5.25% terminal rate in 2024. This is much higher than current market expectations of 3.75%.
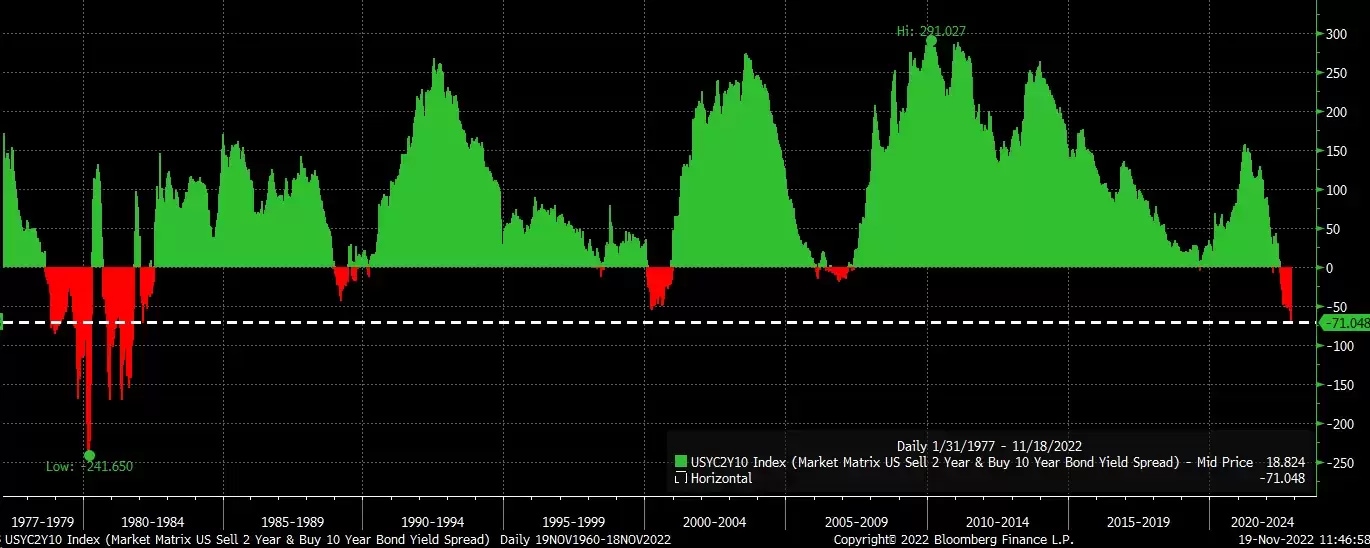
This message would undoubtedly push the two-year treasury note towards 5%, dragging the entire treasury curve higher. Even if we use the current yield curve inversion of 71 basis points on the two-year and 10-year spread, a two-year rate of 5% to 5.25% suggests a 10-year rate of 4.25 to 4.5%. Whether the curve will grow wider is up for debate, but it is currently at its deepest point in 40 years.
Technical trends suggest the two-year rate could rise
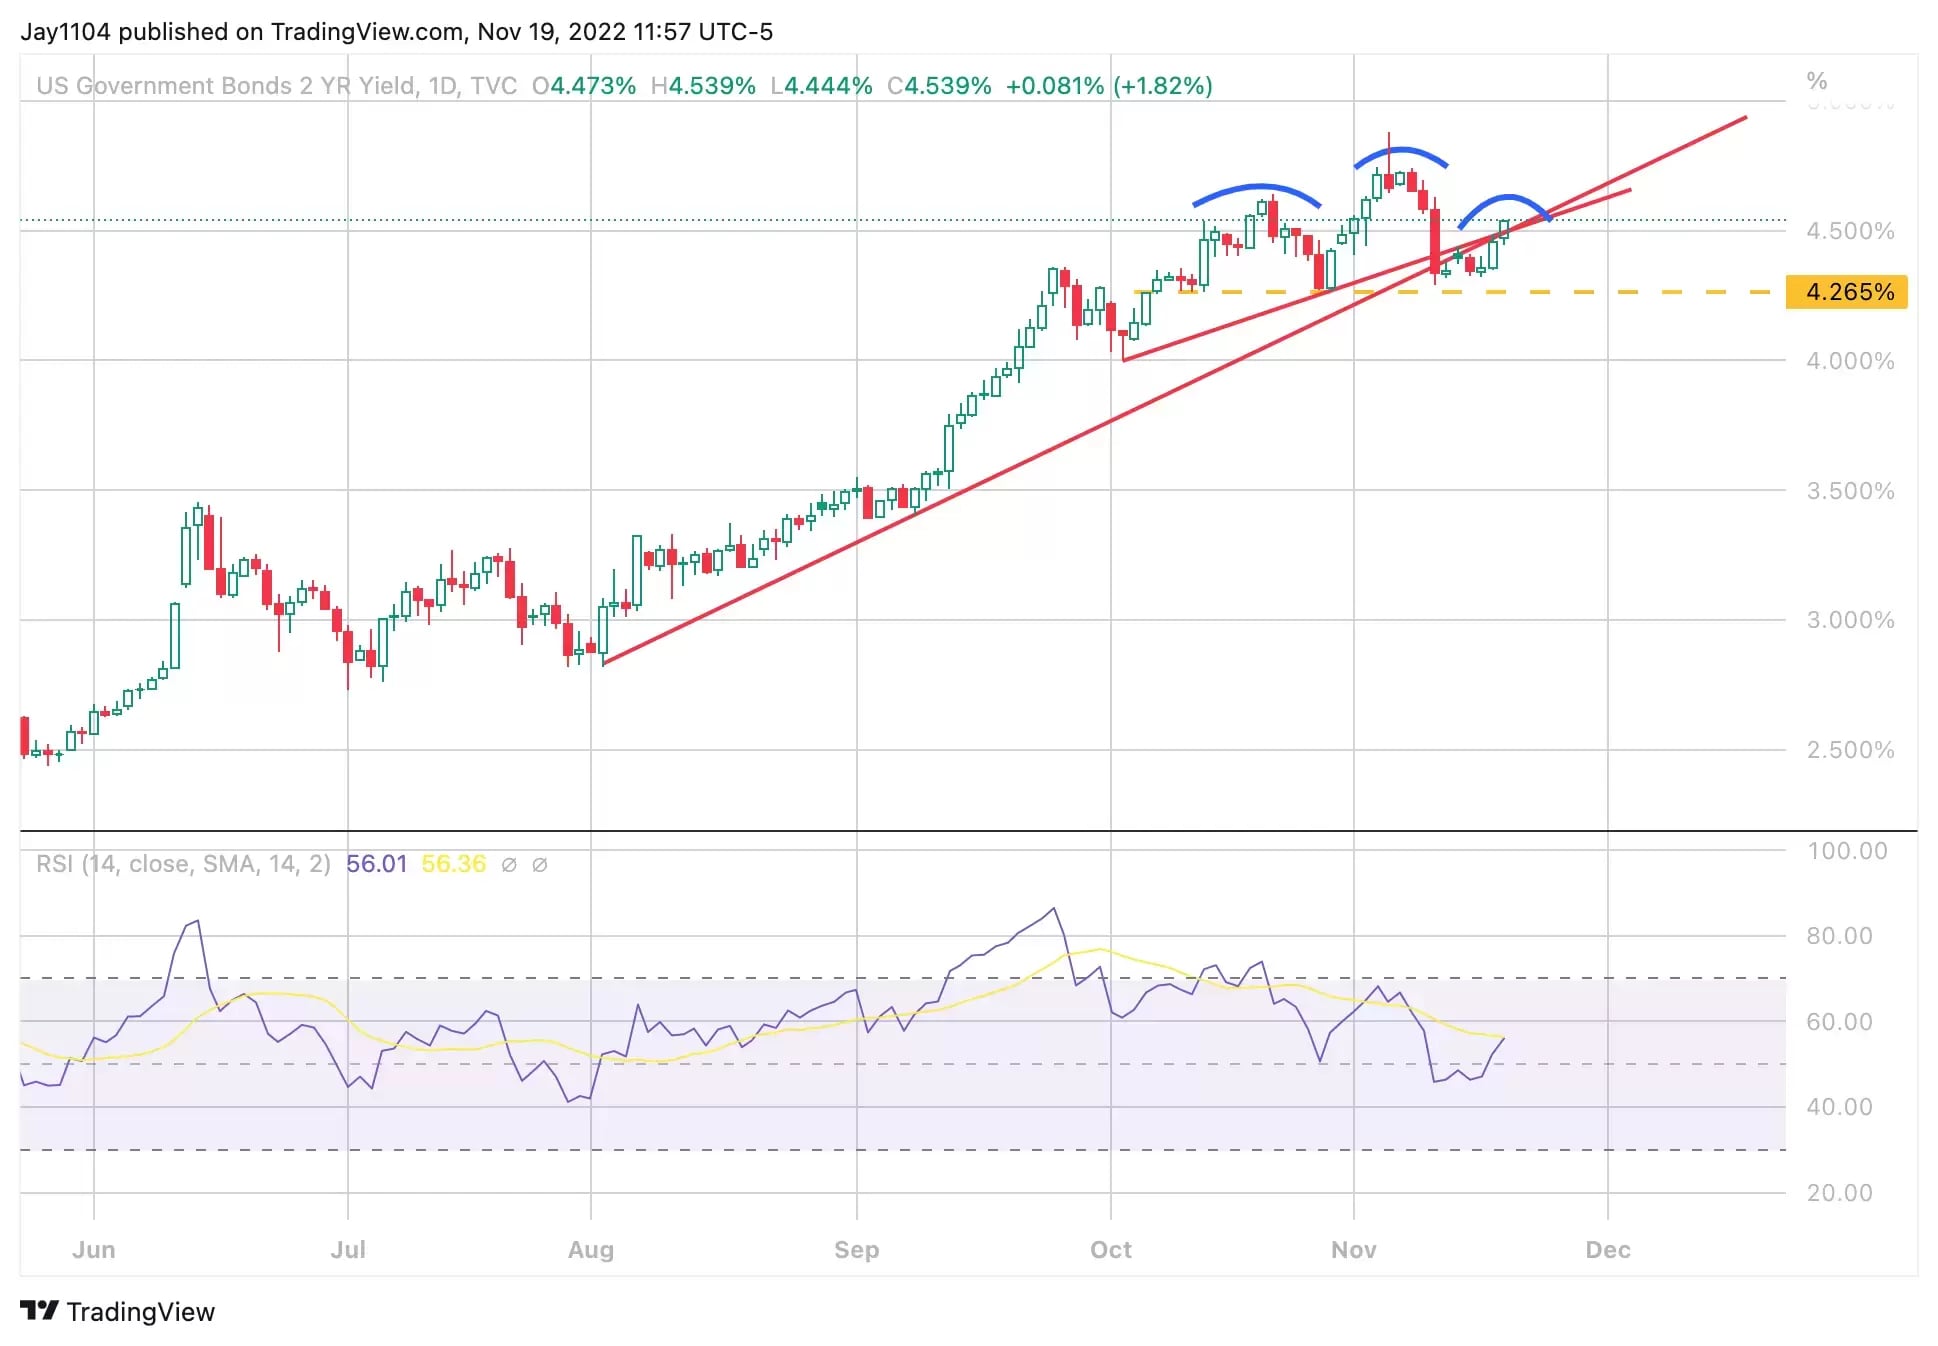
The two-year is still holding on to both the long-term uptrend, which started in August, and the short-term uptrend that began in early October. It almost dropped below both trend lines this month, but bounced back and rose above the two trend lines, suggesting a failed breakdown attempt. From here, the two-year could climb to 5%.
Additionally, the two-year could form a technical reversal pattern known as a head-and-shoulders pattern. However, if the pattern fails to be validated with a neckline break, the usually bearish reversal pattern could become a bullish continuation pattern, as we witnessed in the 10-year rate earlier this year.
The 10-year could be dragged higher
While the 10-year has fallen, it has not broken down. There are still two upward-pointing trend lines that suggest the 10-year could continue to push to higher levels – possibly as high as 4.55%.
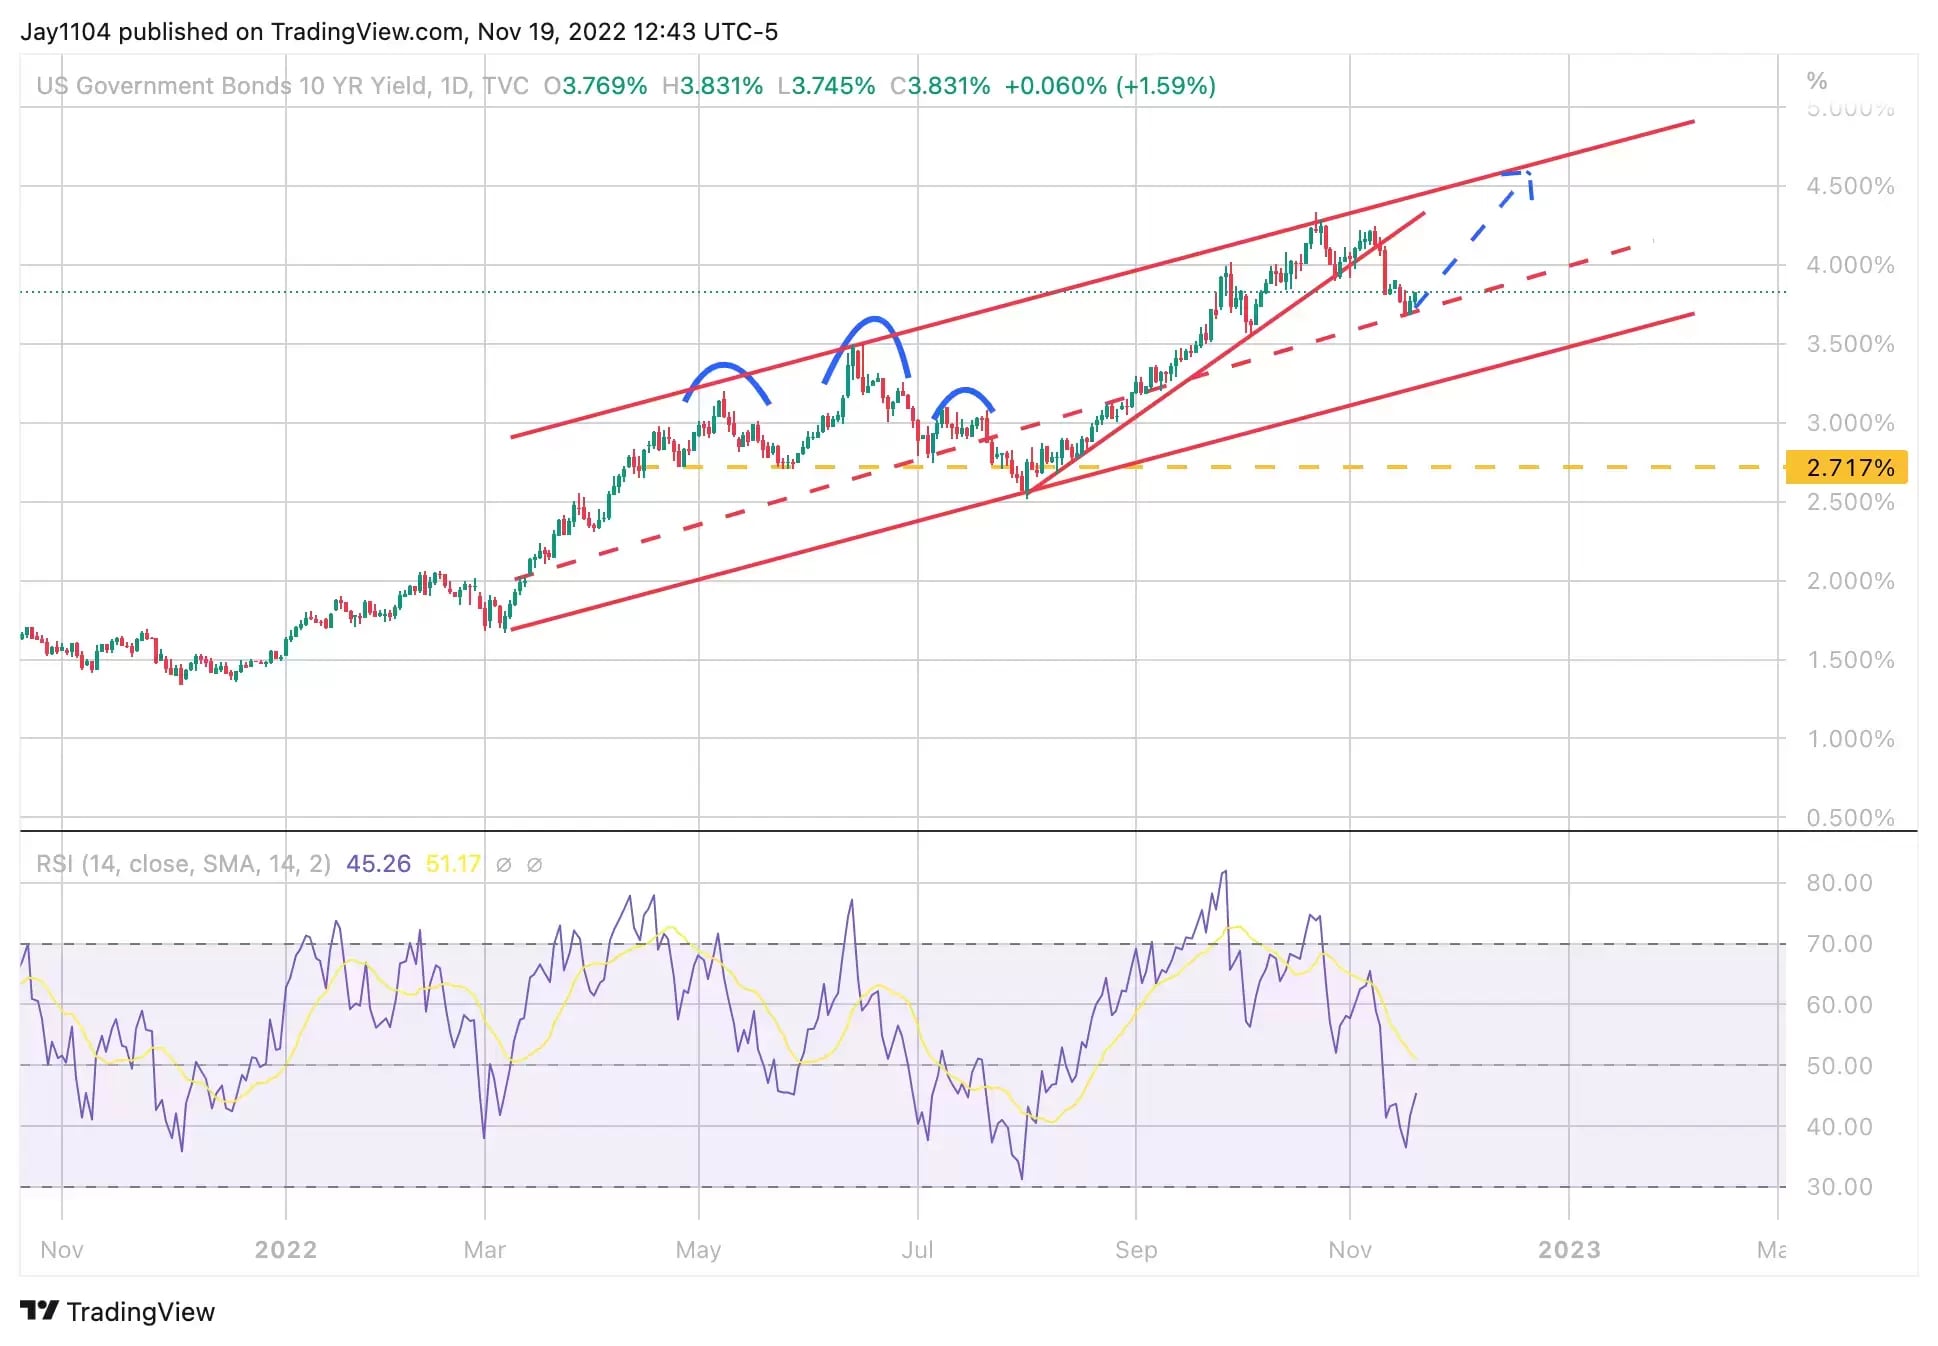
Based on the Fed’s messaging around inflation, there is a distinct possibility that interest rates could go higher and bond prices could move lower. These outcomes seem likely, unless or until the Fed changes its tune on monetary policy, or there is clear evidence that both headline and sticky inflation are falling. For now, though, the path of least resistance for rates appears to be upwards.
Charts used with the permission of Bloomberg Finance LP. This report contains independent commentary to be used for informational and educational purposes only. Michael Kramer is a member and investment adviser representative with Mott Capital Management. Mr Kramer is not affiliated with this company and does not serve on the board of any related company that issued this stock. All opinions and analyses presented by Michael Kramer in this analysis or market report are solely Michael Kramer's views. Readers should not treat any opinion, viewpoint, or prediction expressed by Michael Kramer as a specific solicitation or recommendation to buy or sell a particular security or follow a particular strategy. Michael Kramer's analyses are based upon information and independent research that he considers reliable, but neither Michael Kramer nor Mott Capital Management guarantees its completeness or accuracy, and it should not be relied upon as such. Michael Kramer is not under any obligation to update or correct any information presented in his analyses. Mr. Kramer's statements, guidance, and opinions are subject to change without notice. Past performance is not indicative of future results. Past performance of an index is not an indication or guarantee of future results. It is not possible to invest directly in an index. Exposure to an asset class represented by an index may be available through investable instruments based on that index. Neither Michael Kramer nor Mott Capital Management guarantees any specific outcome or profit. You should know the real risk of loss in following any strategy or investment commentary presented in this analysis. Strategies or investments discussed may fluctuate in price or value. Investments or strategies mentioned in this analysis may not be suitable for you. This material does not consider your particular investment objectives, financial situation, or needs and is not intended as a recommendation appropriate for you. You must make an independent decision regarding investments or strategies in this analysis. Upon request, the advisor will provide a list of all recommendations made during the past 12 months. Before acting on information in this analysis, you should consider whether it is suitable for your circumstances and strongly consider seeking advice from your own financial or investment adviser to determine the suitability of any investment. Michael Kramer and Mott Capital received compensation for this article.
