
Two US markets are moving in the opposite direction of other major stock market indices, as indicated by the Relative Rotation Graph (RRG) below.
Although the Dow Jones Industrials Index (INDU) and, to a lesser extent, the S&P 500 (SPX) are heading in a positive direction inside the leading quadrant, the arrowheads for the Russell 2000 (RTY) and the Nasdaq 100 (NDX) are in the weakening quadrant and heading in a negative direction. This opens up potential pair trading opportunities across US indices.

Interest also lies in the indices with blue tails in the improving quadrant. Markets in the UK (UKX), Japan (NKY) and Australia (AS51) are all travelling with strong, positive momentum, making them ones to watch. Their position suggests that they may outperform relative to our benchmark, the MSCI World Index, in the coming days and possibly weeks.
Australia’s ASX finds support
Although Australia’s ASX index (AS51) recently bounced down off resistance around 7,100, it has now found support at 6,950. Compared to the MSCI World Index, the ASX is picking up strength, as can be seen in the lower pane of the below chart, where both RRG-Lines are moving higher.
Our proprietary data highlight this upturn. The JdK RS-Momentum line (green) has already moved through the 100 level and is now dragging the JdK RS-Ratio line (red) higher. These factors place the arrowhead for the ASX inside the improving quadrant on the above RRG.

Russell 2000 weakens
The price structure of US small-cap index the Russell 2000 (RTY), as shown on the chart below, appears very similar to that of Australia’s ASX. But from a relative perspective they are quite different.
Whereas the RRG-Lines for the ASX are both moving higher, RTY’s RRG-Lines are moving lower. Its RS-Momentum line has already crossed below 100, putting the RTY arrowhead in the weakening quadrant of the RRG that we looked at above. It’s heading in the opposite direction of the ASX.
Our Relative Rotation graphs make these opposing rotations easy to detect and can be used to help generate trading ideas.

Euro drops below dollar parity
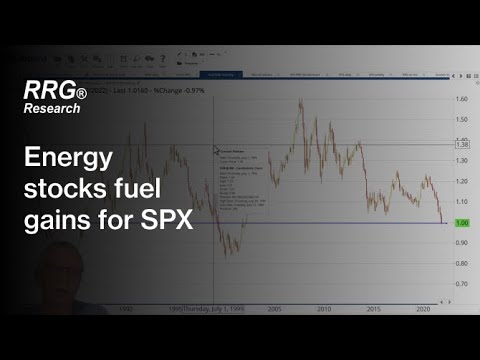
The euro has fallen sharply against the US dollar this year, as the chart below illustrates. Despite the August rally, the euro has again dropped below parity with the US dollar – that psychologically important 1.0000 level is highlighted below by a short, horizontal blue line.

The downtrend, characterised by a series of lower highs and lower lows, follows a typical pattern. As we would expect in this scenario, the market has respected old peaks and troughs, treating them as support and resistance levels.
Based on our data, the upside potential for EUR/USD appears to be limited to the overhead resistance levels marked in the chart above. Meanwhile, an acceleration below 0.9900 would most likely trigger a further move lower, perhaps reaching the consolidation area around 0.9000 that was formed from 2000-2002.
Our S&P 500 share basket is picking up
The current composition of the SPX RRG Momentum+ share basket is made up entirely of energy stocks. This aggressive 100% weighting in energy led to declines when the US energy sector weakened. However, now that the sector is picking up again, our share basket is rapidly catching up with the performance of the S&P 500 and has surpassed that benchmark over a 30-day period.
Exxon Mobile [XOM] is the biggest stock in the energy sector and therefore an important driver of the sector’s overall performance. As I discuss in the video above, the XOM arrowhead is inside the weakening quadrant but starting to curl back up. It also has the highest RS-Ratio reading in this group of stocks.
As we can see in the below chart, XOM has just cleared overhead resistance at 98 and stalled at the top of the gap that was formed from 10-13 June. If XOM can take out that level of overhead supply, maybe after a short consolidation around 98-100, the next target lies near 105 – the level of the previous high in June. No doubt such a move would have a positive effect on the performance of the SPX 500 Momentum+ share basket as well.

Pricing is indicative. Past performance is not a reliable indicator of future results. RRG’s views and findings are their own and should not be relied upon as the basis of a trading or investment decision.


