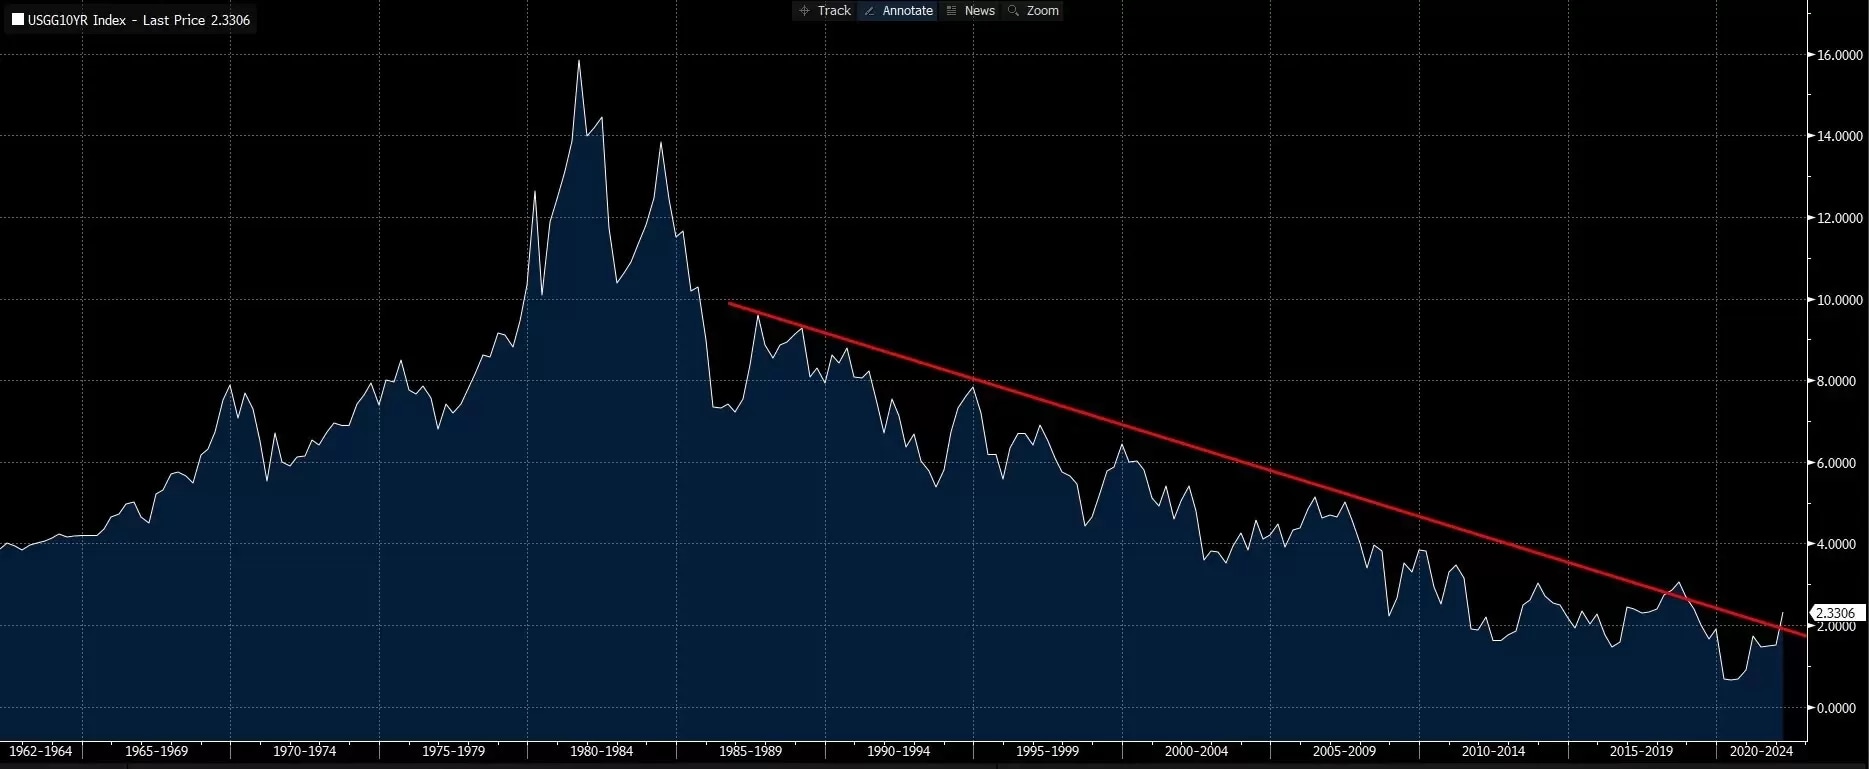
Since March, the US 10-year bond yields jumped on the accelerating US bond selloff by the Japanese investors to lock on the year-end profit as the expectation for the Fed to accelerate rate hikes strengthens. The 10-year Treasury yield surged from the month-low of 1.68% to as high as 2.55% on Monday. Japan is the largest US bond holder globally, which sold US$25.5 billion worth of foreign bonds from February to March 20, according to The Wall Street Journal. The surging US bond yields triggered a sharp USD appreciation against the Japanese Yen. But notably, the selloff halted in the last two days, the US 10-year Treasury yield fell from the crucial level of 2.55%, to 2.34% on Wednesday, suggesting investors start rotating the funds back to the bond markets for a discounted price. So, what does this mean to the broader markets?
The 10-year US treasury yield may pull back at the descending trendline

Source: Bloomberg
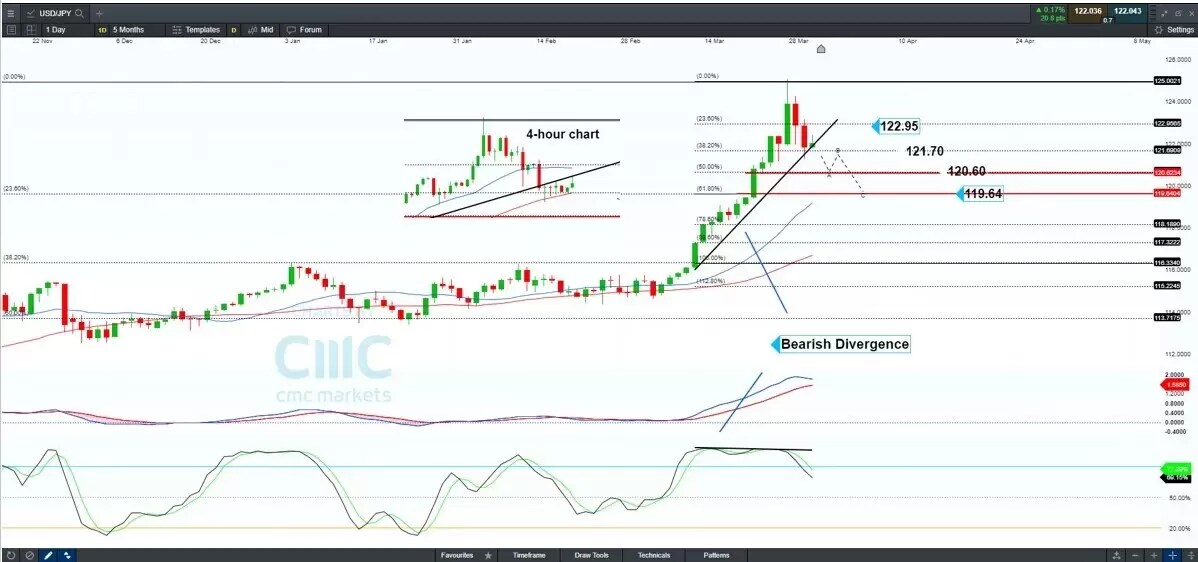
USD/JPY may continue retreating as bonds rebound
Coming into April, the USD bond yields, particularly for the long-dated maturities, may continue to fall as investors may start buying bond back for hedging purposes amid an inflation-induced economic slowdown. The USD may weaken against the other currencies, especially the Japanese Yen.
USD/JPY - Daily

Key technical elements:
- A potential bearish break-out at the upward trendline indicates the near-term uptrend might end.
- Stochastic and the price are forming a bearish-divergence pattern, which signals an uptrend reversal.
- MACD shows the upside momentum is fading, with two moving averages forming a dead-cross ahead, adding to the bearish bias.
Key price levels:
Supports: 121.70, 120.60,119.64
Resistances: 122.95
Stock markets may face pressure
The US stocks may face headwinds as investment funds may rotate out of the risky assets to the bond markets. However, the first-quarter earnings may overshadow the inflation concerns. The bull markets may last throughout April but are unlikely to continue in May when it is usually a time for investors to divest their holdings, or what we call “Sell in May and Go Away”.
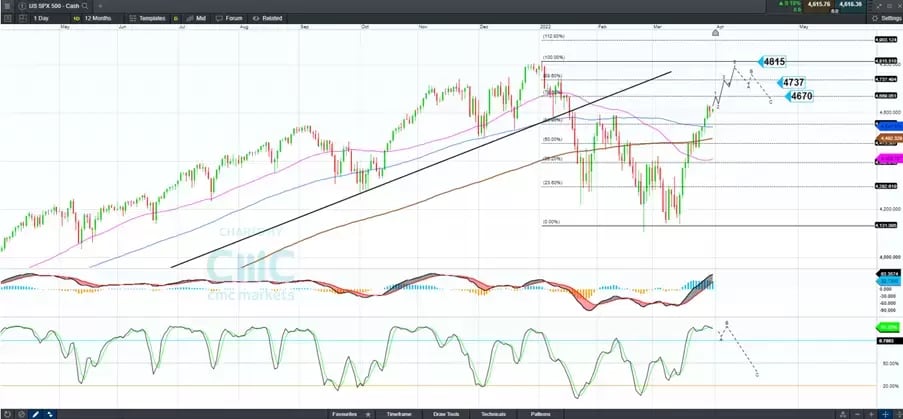
S&P 500 (Cash) – Daily

Key technical elements:
- MACD suggests that the uptrend momentum is still strong, with the moving averages crossing over the mid-line.
- Stochastic enters into the overbought territory, which suggests a near-term pullback might be near
Key price levels:
Supports: 4541, 4473
Resistances: 4670, 4737


