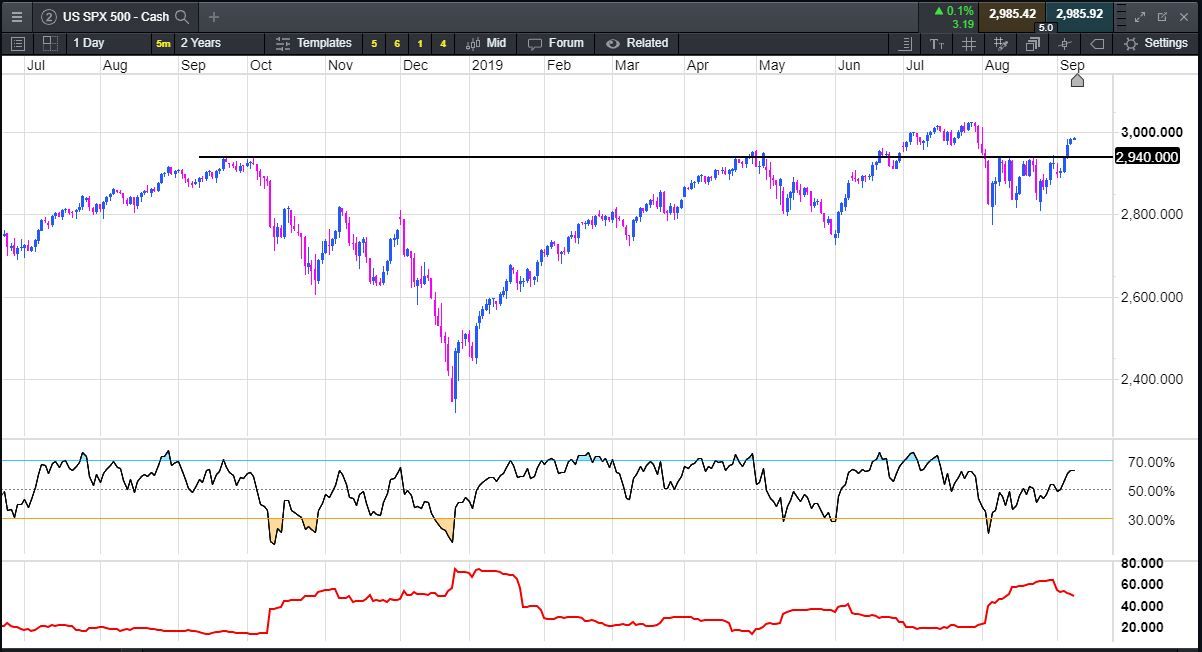
Trade disputes, slowing growth, central bankers running out of conventional options, analysts predicting recession. Surely share markets must be under extraordinary pressure? Except that they're not. As the chart above shows, the US SPX 500 index is less than 2% from its all-time high.
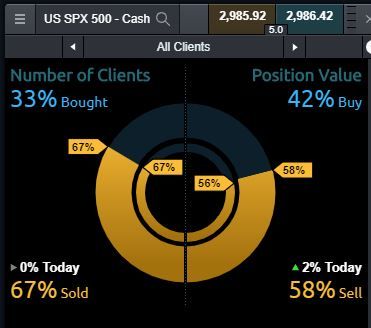
It's little wonder that traders and investors are concerned about the outlook for shares, especially in the US:

The majority of CMC clients with positions in the US SPX 500 index are short. For every one buyer, there are two sellers. Whether these sold positions are a hedge of phyiscal stock holdings or not, sentiment is clearly negative.
There are fundamental explanations for the strength of shares. Extraordinarily low interest rates not only reduce company costs, they boost share valuations. The highest ever global money supply means there is a lot of cash looking for a home, and share markets may represent the "least worst" option for investors. The drivers of the recent rallies, and the longer term bull market, are the subject of many robust, late-night discussions among traders.
The chart is a lot less arguable. The 2,940 level is an important point of resistance for the most popular measure of US stocks. The break of this level a few sessions ago is a positive signal. The RSI at the bottom of the chart is not only making newer highs, it is still well below overbought territory. And volatility is dropping (red line at the bottom).
A fall below 2,940 would negate the positive outlook. But until this occurs, the chart suggests a test of the all-time high for the US SPX 500 is more likely than not.


