The jobs market in the US has remained robust despite the Federal Reserve's efforts to cool the economy. While the pace of hiring has slowed to some degree, it is still running hot enough that wages are expected to have increased in December. This would keep the Fed on its hawkish path. Until the Fed pivots, stocks and bonds are likely to suffer over the long term.
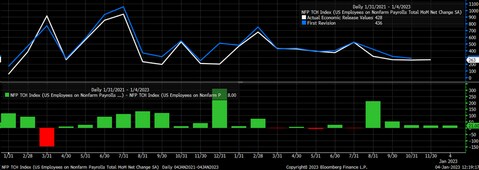
For December, analysts estimate that non-farm payrolls increased by 200,000, down from the 263,000 jobs created in November. Average hourly earnings are expected to have climbed by 0.4% month-on-month, versus a November increase of 0.6%, and to have increased by 5% year-on-year, almost in line with November's 5.1% increase.
Alongside the December readings, revisions to the November data could be equally important. Since August, there have been some significant upward revisions to the previous month’s non-farm payroll print, suggesting that the job market has been stronger than initially thought. Upward revisions could be more troublesome than the December data.
Unemployment rate likely to remain low
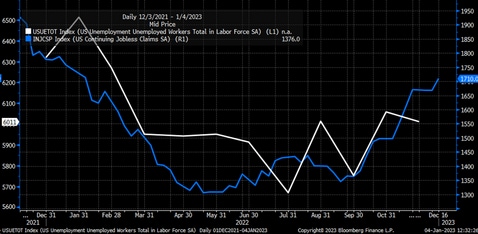
The unemployment rate will help shape the Fed’s view of whether the job market is slowing. At this point, unemployment remains very low and is expected to come in at 3.7% for December. However, there is some evidence that the rate may soon tick higher, at least when comparing the total number of unemployed people versus continuing jobless claims. Initial jobless claims have risen over the past few weeks, which could be a leading indicator for the number of unemployed workers.
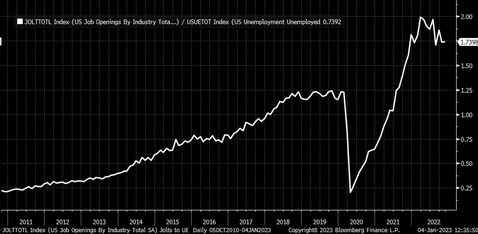
The number of unemployed workers has remained low because there are approximately 1.7 vacancies for every unemployed person. The latest Job Openings and Labour Turnover Survey (JOLTS) data, which measures the number of job vacancies, showed that in November there were 10.45 million open jobs and only six million unemployed workers.
Before the pandemic, the ratio was closer to 1.25. This is likely the level to which the Fed would like the ratio to return. Ideally, officials want the number of job openings to come down to match the number of unemployed workers.
As long as the number of job openings remains high and there are not enough workers to fill all the vacancies, unemployment is likely to stay relatively low, and upward pressure will buoy wages. Therefore, there isn’t likely to have been a significant deceleration in wages or hires in December.
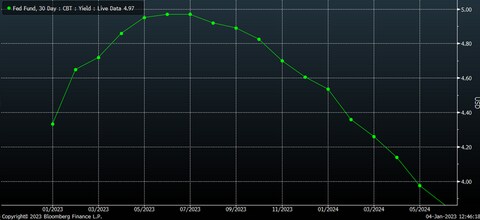
On top of unemployment factors, the bond market is struggling to buy into the Fed’s narrative of rates climbing to 5.1% in 2023 and staying there. Based on the Fed Funds Futures, rates could rise to a peak of 5% by July and then fall to around 4.6% by December 2023, despite the Fed dot plot showing rates at 5.1% by the end of 2023.
Treasury rates seem too low
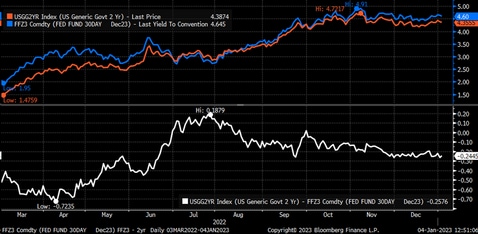
If we continue to see hot wage data, then bond yields may appear too low. This is problematic, as bond yields need to rise, especially the two-year Treasury rate, which trades at 4.25%. The two-year is the one that could suffer the most following hotter-than-expected jobs data because the Fed Funds Futures is likely to start pricing in that higher-for-longer terminal rate from the Fed.
The difference between the two-year rate and the December Fed Funds Futures contract has been around 25 basis points since the end of November. If jobs data for December indicate hot wages and strong employment, then the market is likely to push Fed Funds Futures rates higher, potentially dragging the two-year rate with it.
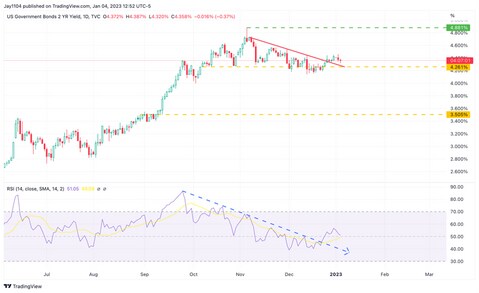
That scenario could create a path for the two-year to climb towards its highs around 4.9% over the coming months, as it appears to have broken a downtrend on both price and the relative strength index. A key test for the two-year rate is whether it can continue to hold on to support at 4.25%.
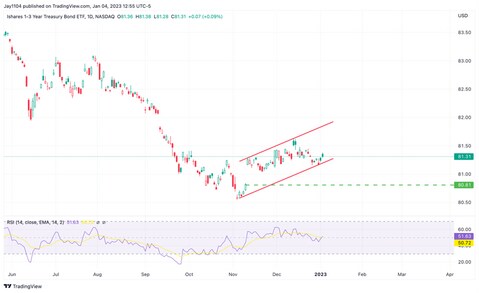
In the near term, bond proxies like the iShares 1-3 Year Treasury Bond ETF (SHY) could head lower, potentially filling the gap down to around $80.80.
Stocks look overvalued
Now let’s return to the Fed’s intention to raise interest rates and keep financial conditions tight. In this environment, stocks typically struggle to advance. This suggests that the S&P 500 could either consolidate sideways or go lower, while rallies may be short-lived. Although it is possible that we could see rallies like those of March, August and November 2022, they are likely to end in similar fashions.
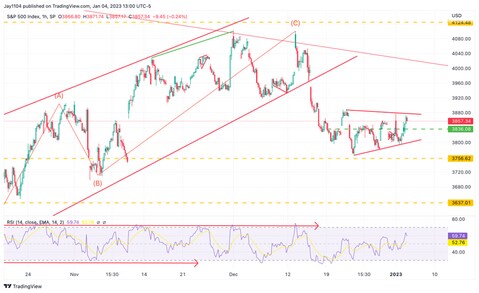
Since dropping more than 8% between the 13 December high and the 22 December low, the S&P 500 has consolidated sideways in the range of 3,760 to 3,890. When stocks are in an uptrend and consolidating sideways, it can provide a resting period, acting in place of a drawdown. However, when stocks are in a downtrend and the market consolidates, it can substitute for a short-term rally. The latter is what the current period of consolidation in the S&P 500 appears to be.
If the S&P 500 breaks below 3,750, then the most likely stop for the index comes at a gap of around 3,580, erasing nearly the entire November rally.
Friday’s job report therefore comes at a critical moment for equity indexes and rates. It will take a string of weak data readouts for the Fed to deviate from its current path, so the long-term trends for stocks and bonds seem unlikely to change any time soon.
Charts used with the permission of Bloomberg Finance LP. This report contains independent commentary to be used for informational and educational purposes only. Michael Kramer is a member and investment adviser representative with Mott Capital Management. Mr Kramer is not affiliated with this company and does not serve on the board of any related company that issued this stock. All opinions and analyses presented by Michael Kramer in this analysis or market report are solely Michael Kramer's views. Readers should not treat any opinion, viewpoint, or prediction expressed by Michael Kramer as a specific solicitation or recommendation to buy or sell a particular security or follow a particular strategy. Michael Kramer's analyses are based upon information and independent research that he considers reliable, but neither Michael Kramer nor Mott Capital Management guarantees its completeness or accuracy, and it should not be relied upon as such. Michael Kramer is not under any obligation to update or correct any information presented in his analyses. Mr. Kramer's statements, guidance, and opinions are subject to change without notice. Past performance is not indicative of future results. Past performance of an index is not an indication or guarantee of future results. It is not possible to invest directly in an index. Exposure to an asset class represented by an index may be available through investable instruments based on that index. Neither Michael Kramer nor Mott Capital Management guarantees any specific outcome or profit. You should know the real risk of loss in following any strategy or investment commentary presented in this analysis. Strategies or investments discussed may fluctuate in price or value. Investments or strategies mentioned in this analysis may not be suitable for you. This material does not consider your particular investment objectives, financial situation, or needs and is not intended as a recommendation appropriate for you. You must make an independent decision regarding investments or strategies in this analysis. Upon request, the advisor will provide a list of all recommendations made during the past 12 months. Before acting on information in this analysis, you should consider whether it is suitable for your circumstances and strongly consider seeking advice from your own financial or investment adviser to determine the suitability of any investment. Michael Kramer and Mott Capital received compensation for this article.


