The SPX 500 RRG Momentum+ share basket is performing very well this quarter. While the US SPX 500 index is down 5.4%, the share basket is up 16.5%. Very strong contributions are coming from Xylem, WW Grainger, and ON Semiconductor, which are all showing returns of 20% or more over the last 30 days.
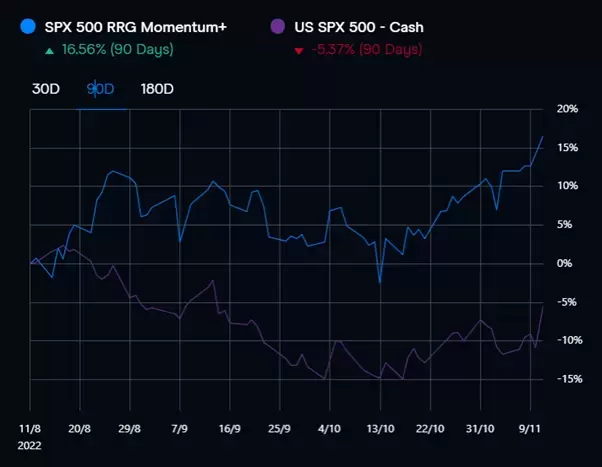
These big deviations underscore that it absolutely makes sense for traders to look under the hood of an index to search for trading opportunities in individual stocks. Following the strong performance of the basket so far in this quarter, I ran our scan for shorter-term opportunities in the SPX 500 this week.
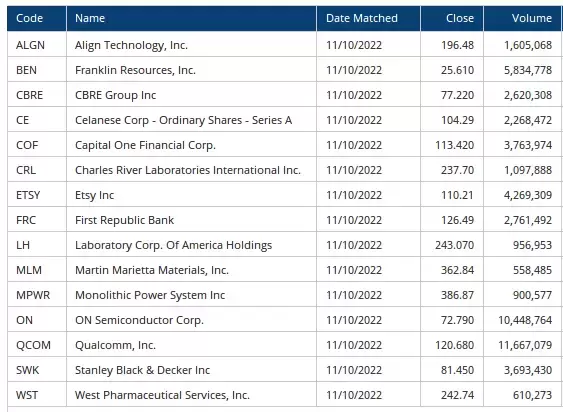
After Thursday’s close, this triggered 15 names, listed in the table below.
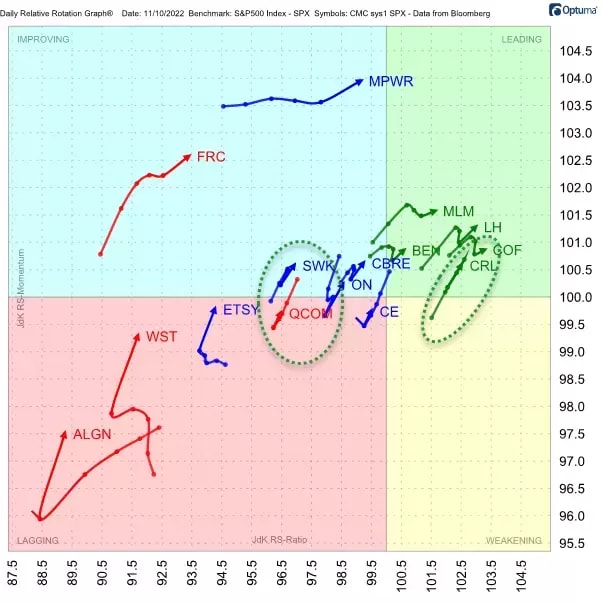
This led me to four interesting charts which are showing potentially interesting turnarounds.
Qualcomm [QCOM]
The recent decline in QCOM took the stock price down from above $150 to below $110 in roughly two months. QCOM found support at $105 in October. The bounce off that low than ran into horizontal resistance at 120, coming off the lows set in October 2021 and June-July 2022.
The move after testing that resistance level is interesting. A quick decline even with a big gap at the start of November, took the price to a low at $102, but only for a day as QCOM managed to get back up on its feet again and move back above the $105 support level very rapidly.
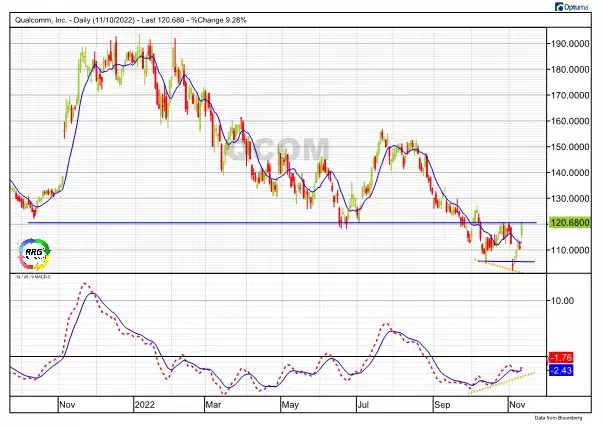
It’s clear that investors are picking up the stock in that $105 area. When we take a look at the MACD indicator, plotted below the chart, we can see that a positive divergence is building. The indicator has already started to move up, while the price dropped to a new low. This is usually a sign that indicates underlying strength for the stock price.
Positive divergence in itself is not a 'signal' – we need confirmation or a trigger to validate that divergence. In this case, that would be a break above the horizontal barrier at $120. Such a move would complete a double-bottom formation, which is then backed up by this positive divergence, opening up new upside potential.
Stanley Black & Decker [SWK]
At the start of 2022, SWK traded around $190. During the course of the year the price dropped to lows near $70. On the daily chart below, that 70-level just shows up, and one might wonder, why has the stock sunk to $70?.
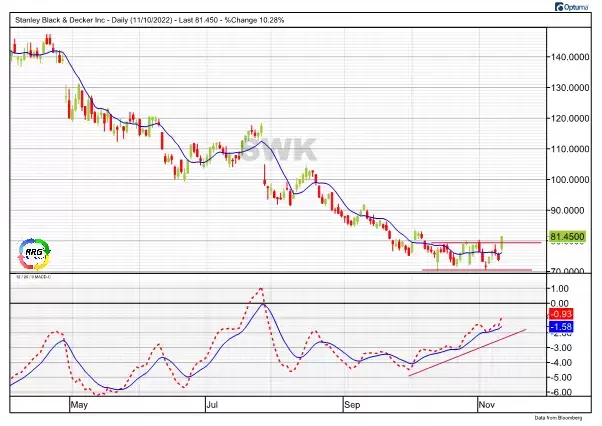
As I mentioned on QCOM, that divergence in itself is not enough. We need a trigger. And in the case of SWK, we have already had that trigger, as it broke above the upper boundary of that trading range. There are still a few overhead resistance levels to be conquered for SWK, but the worst seems to be over for now.
Charles River Laboratories International [CRL]
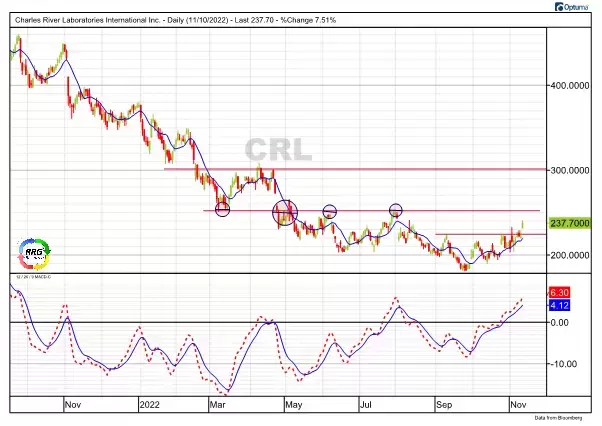
The third potential turnaround is found in CRL. The rapid deceleration in this stock stopped in June, when the price action found support near $200. The rally out of that low then ran into trouble again near $250, where the stock has already formed a few previous highs and lows – a level that’s clearly an area of interest.
Pricing is indicative. Past performance is not a reliable indicator of future results. RRG’s views and findings are their own and should not be relied upon as the basis of a trading or investment decision.

