We're preparing for a February that should bring plenty of volatility across several markets. In this post we update our forecasts for gold and crude oil, both of which we last covered in late November. International oil benchmark Brent crude has followed our bearish expectations better than gold has, but we remain sceptical of the yellow metal’s rally.
Gold rallied higher than we expected
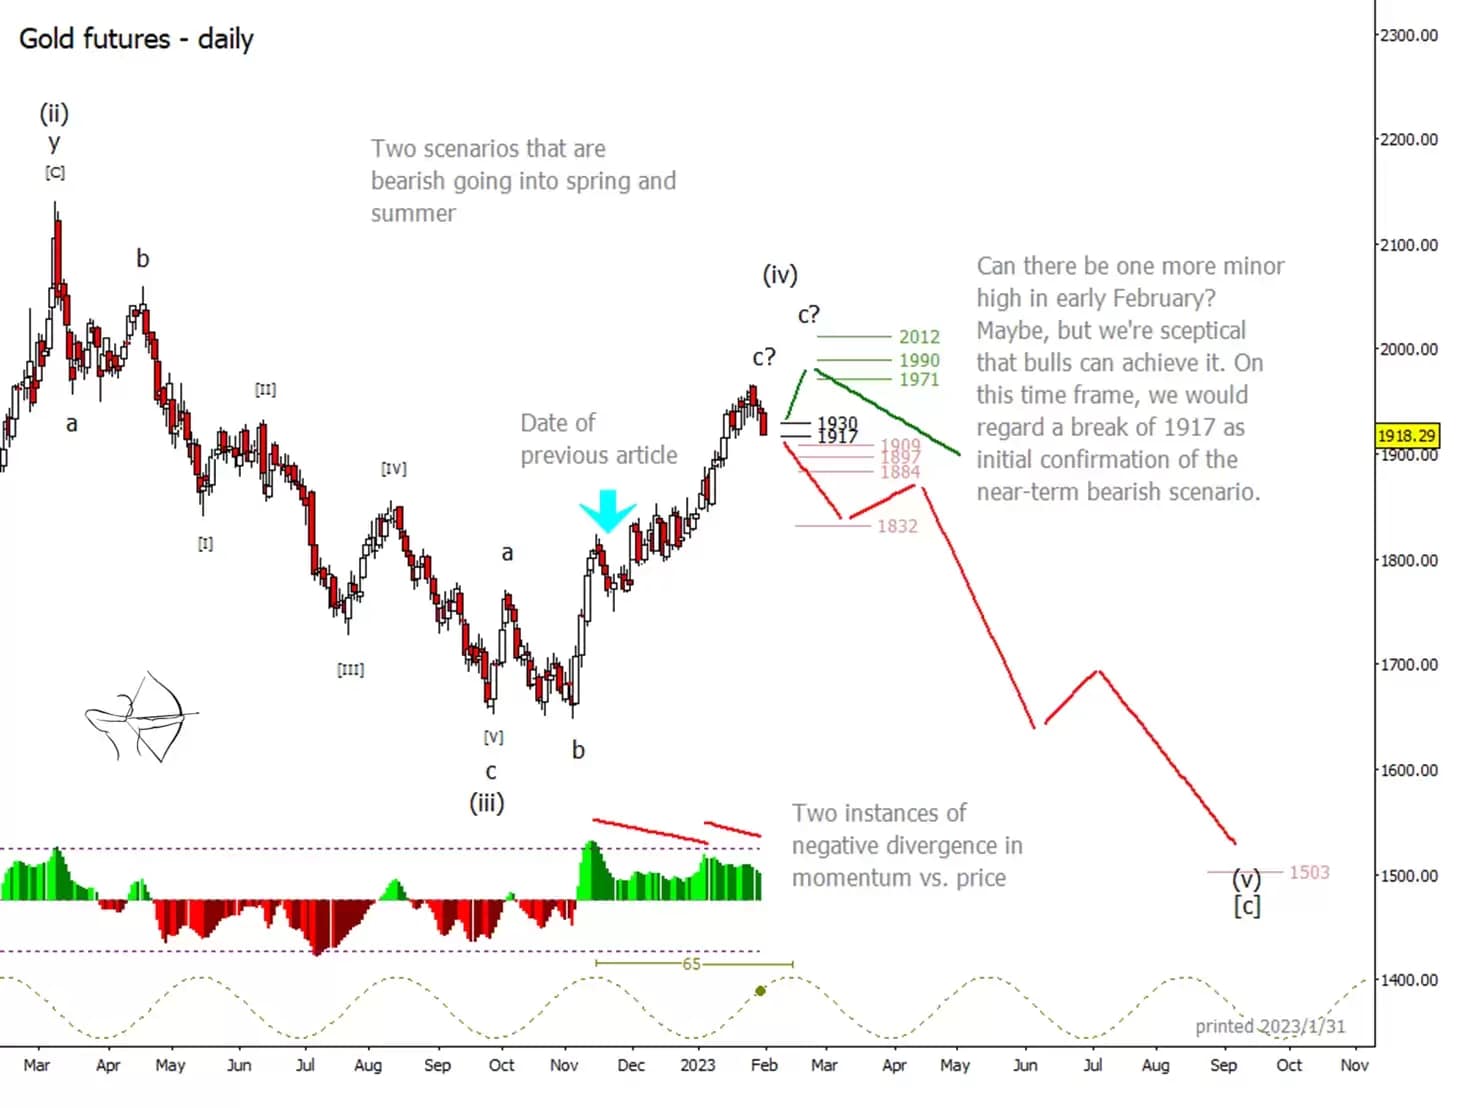
On the daily chart for gold futures, below, you can see how price rallied from soon after our article was published on 24 November (marked with a blue arrow) and continued much higher than we expected. Being wrong sometimes is part of market forecasting, but with Elliott Wave techniques the trader has a better idea of what to expect if the "wrong" scenario plays out.
The key to staying on the right side of the market with any wave-counting method is to plan your trades in reference to confirmation signals and price levels. When applying Elliott Wave theory, the confirmation of a scenario often occurs when price breaks through a level that disproves competing scenarios (or renders them unlikely). In the case of gold in November, price never broke below the confirmation line we suggested at $1,717 an ounce.

Looking at competing scenarios going forward, the question is whether wave 'c' of (iv) is complete or not. Momentum continues to point strongly upward, although there is significant negative divergence on the Commodity Channel Index (CCI) momentum indicator. Under a near-term bullish scenario, the market might first look for support near $1,917. Beyond that, the price could try for targets shown in green at $1,971, $1,990 and perhaps $2,012 in the next upward sub-wave.
In contrast, our preferred near-term bearish scenario for gold begins with a daily close beneath $1,917, followed by successive tests of the middle supports shown in red at $1,909, $1,897 and $1,884. The bullish scenario could still be possible while price is in the middle support area, but we believe it will become less probable. A break beneath $1,884 could provoke a quick tumble to $1,832.
Brent crude posts series of lower highs
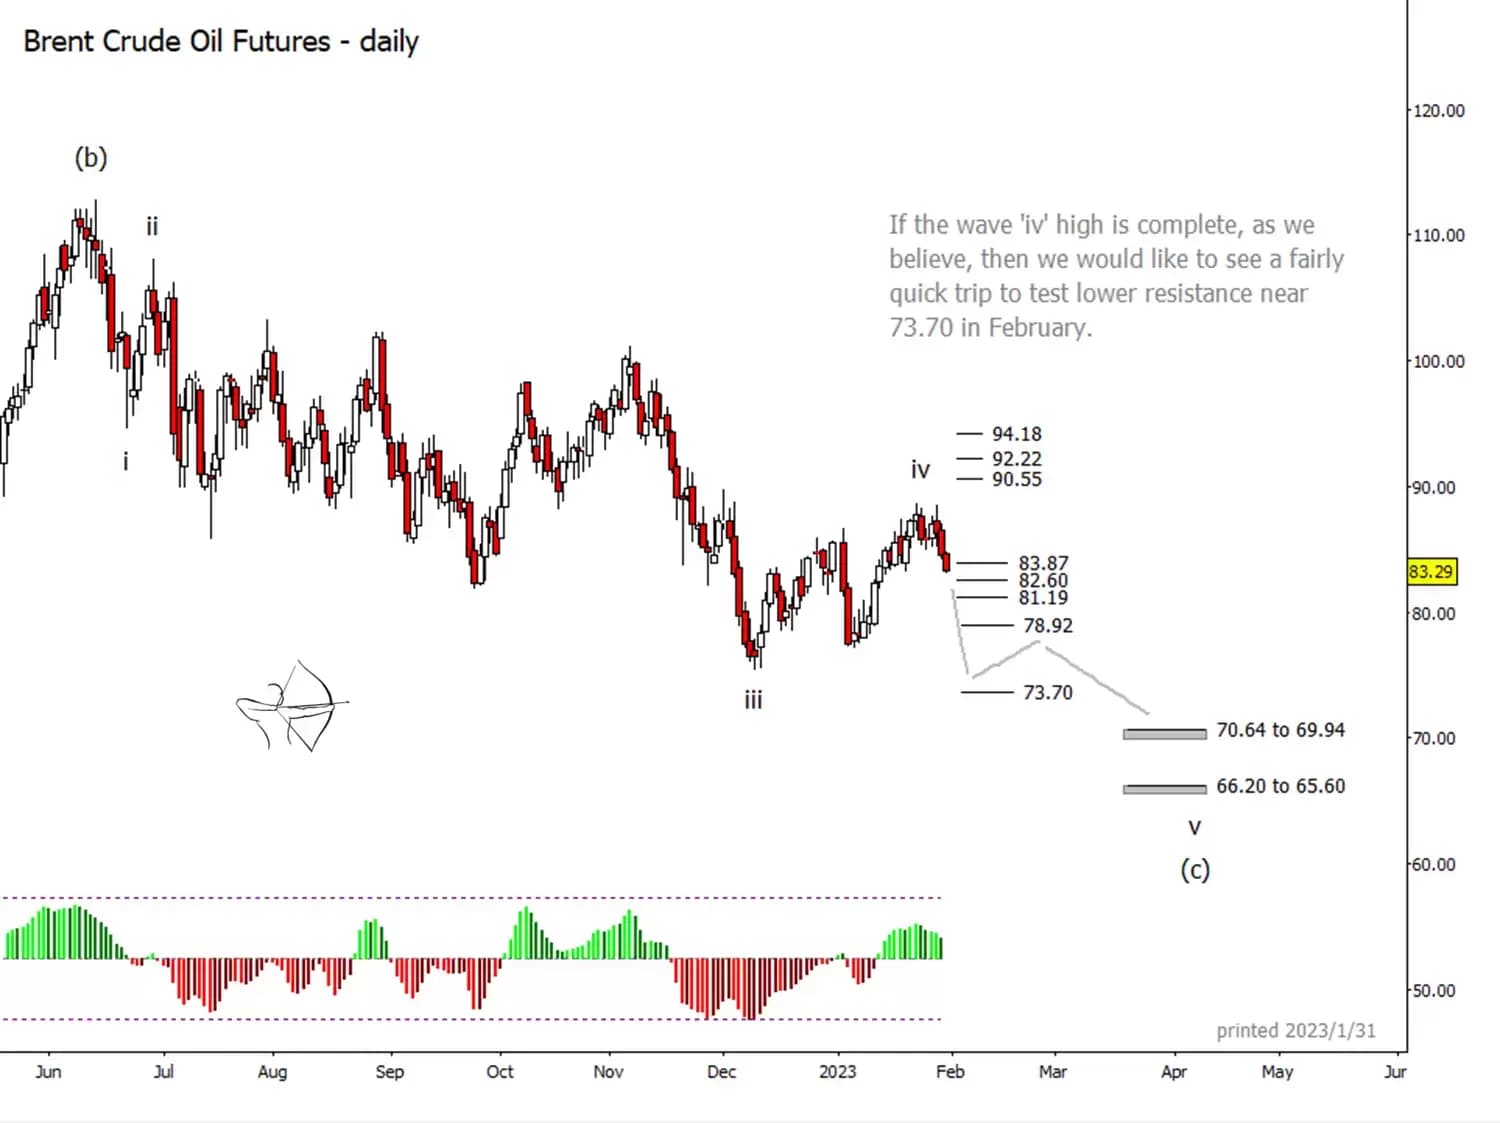
Crude oil has adhered more closely to our expected path, although we have revised the wave count that we outlined for West Texas Intermediate in our 24 November article and translated it to the market for Brent. We think the wave 'iv' high was probably set on 23 January, with the market making a slightly lower high on 27 January, as shown on the chart below. A high followed by a lower high suggests that the market may have completed tiny sub-waves 'I' and 'II' of downward wave 'v'. The tiny sub-waves are not actually labelled on the chart.
If sub-waves 'I' and 'II' are complete, that would have price falling now in a third sub-wave, which usually turns out to be the strongest one in the series. This can be good news for bears who are already in position, but it can turn into a chasing game for bears who were late to see the move.

If the market recognizes the supports identified in this bearish scenario, then ideally we would see price interact with the middle supports ($83.87 a barrel, $82.60, $81.19 and $78.92). Each break beneath a support prefaces a bounce to test the same support from beneath. Some of the steps might be quite high though. A break of $78.92 could lead to a fast plunge into the area around $73.70.
Our bigger-picture target zones for spring or summer range from $70.64 to $69.94 and from $66.20 to $65.60, at which point the trend could shift upward.
If the oil market disregards our forecast and instead climbs upward, then the resistance levels at $90.55, $92.22 and $94.18 could become targets.
For more technical analysis from Trading On The Mark, follow them on Twitter. Trading On The Mark's views and findings are their own, and should not be relied upon as the basis of a trading or investment decision. Pricing is indicative. Past performance is not a reliable indicator of future results.


