By Chloe Edwards, Trade With Precision
The US stock indices have not looked back since they broke to all-time highs at the end of October. This has yielded some shorter-term opportunities to buy on both the daily and lower timeframes of all the major US indices – the US SPX 500, US NDAQ 100 and US 30.
I continue to monitor these indices for further long opportunities. However, I have also been waiting for a bigger pullback on the daily or weekly timeframe in order to continue to build a higher reward to risk swing position.
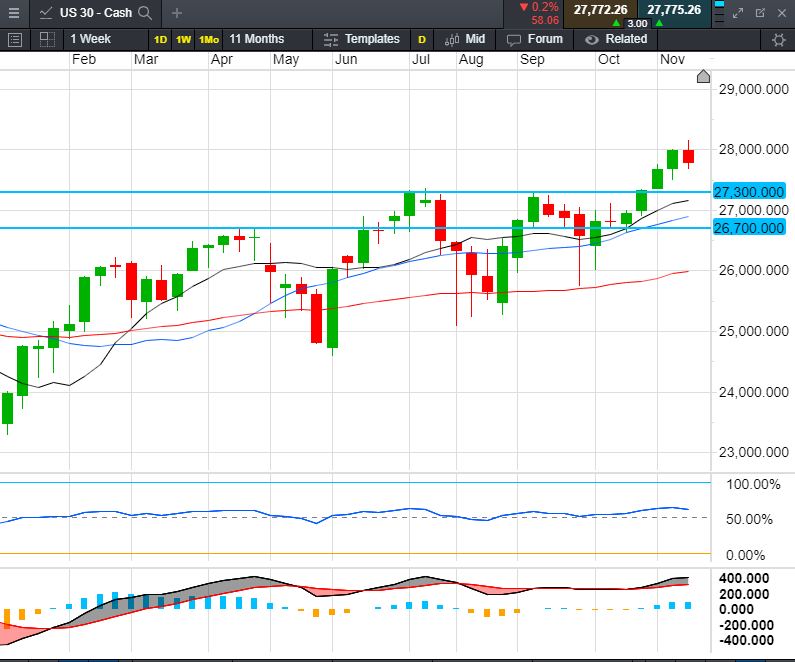
The index I am currently focusing most of my attention on is the US 30 due to the proximity of price to a potential horizontal level of support. This horizontal level of support - at around 27,300 - is shown on the weekly chart above, along with a slightly lower horizontal level at around 26,700.
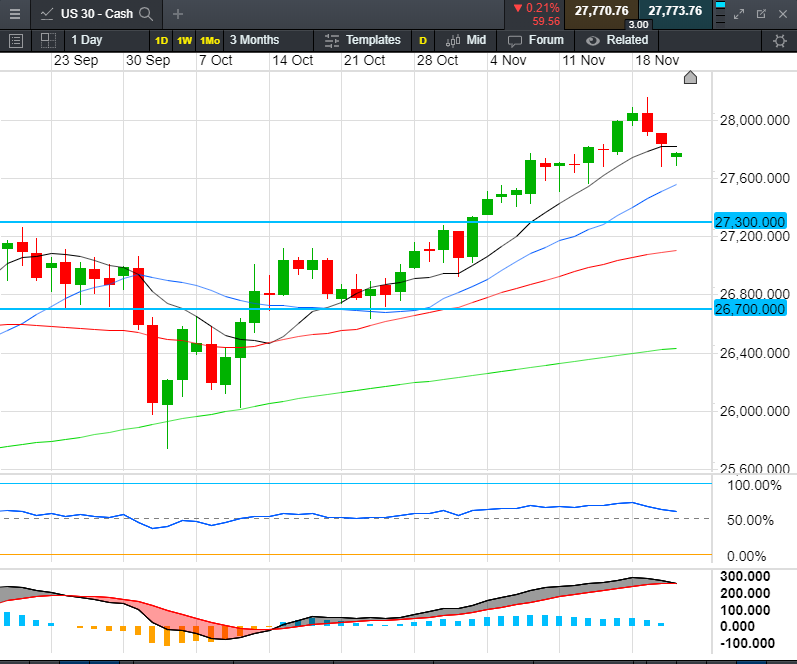
On the daily chart (below) I can see price action forming a series of higher lows and higher highs, indicating that there is an uptrend in place. I also notice that the 10, 20 and 50 period moving averages (MAs) are lined up and show bullish geometry, pointing upwards and fanning out.
Both the MACD and the RSI indicators are trending higher and showing bullish convergence, which could confirm the momentum of the uptrend. Price has pulled back into the buy zone, the area in and around the 10 and 20 period MAs.
I will be awaiting the formation of a small-sized bullish candle in this buy zone in order to indicate a possible long trading opportunity. If this opportunity does not arise, I will be awaiting a bigger pullback into the 27,300 level, as a re-test of this level could offer an area to look out for a potential long trade setup.

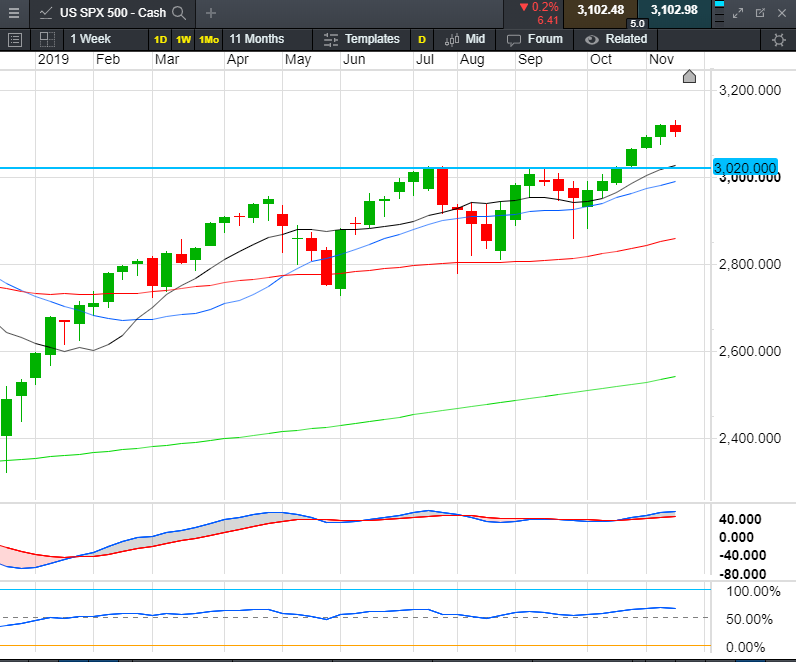
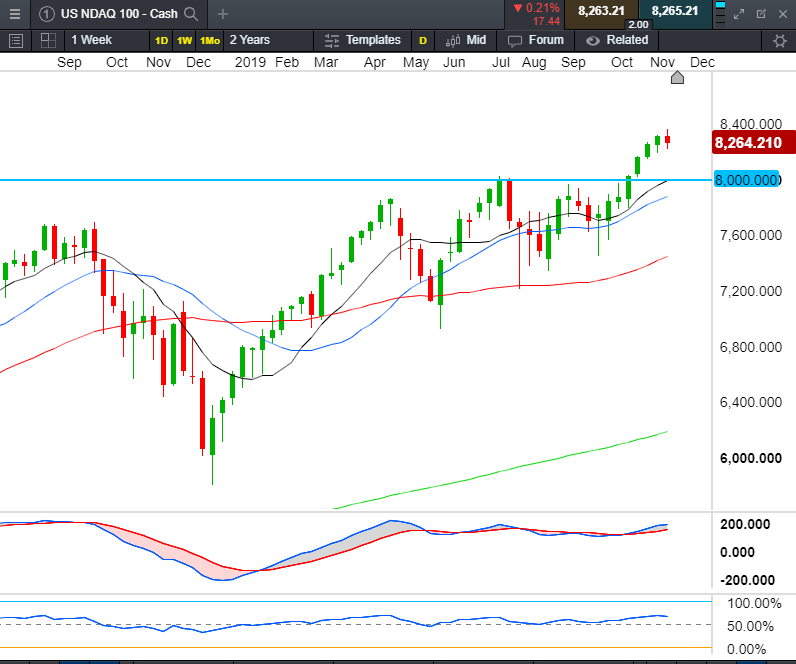
The US SPX 500 and US NDAQ 100 are showing similar price action, with the weekly timeframes showing a strong trend. Of particular interest are the horizontal levels of 3,020 on the SPX 500 and 8,000 on the US NDAQ 100 below.


I will continue to look for long setups across the board where I see bullish price action of higher highs and higher lows, combined with the correct MA geometry, bullish convergence of indicators, and small-sized bullish candles in the buy zone.
For the longer term, I will be awaiting bigger pullbacks to significant horizontal levels.


