After an initial bullish feint on last week's consumer price index (CPI) data, the Dow 30 and Nasdaq 100 started to follow the more bearish alternative paths we mentioned last week.
With two as-yet unfilled overnight gaps in each index, the negative price action this week has increased our confidence that the next set of declining impulsive moves has begun.
In the very near term, we think both indices are slightly oversold, so we would prefer to see a sideways/upward consolidation for one or two days before the downward trend resumes. An initially bullish response to Thursday's US GDP report, or Friday's PCE index, could provide that respite.
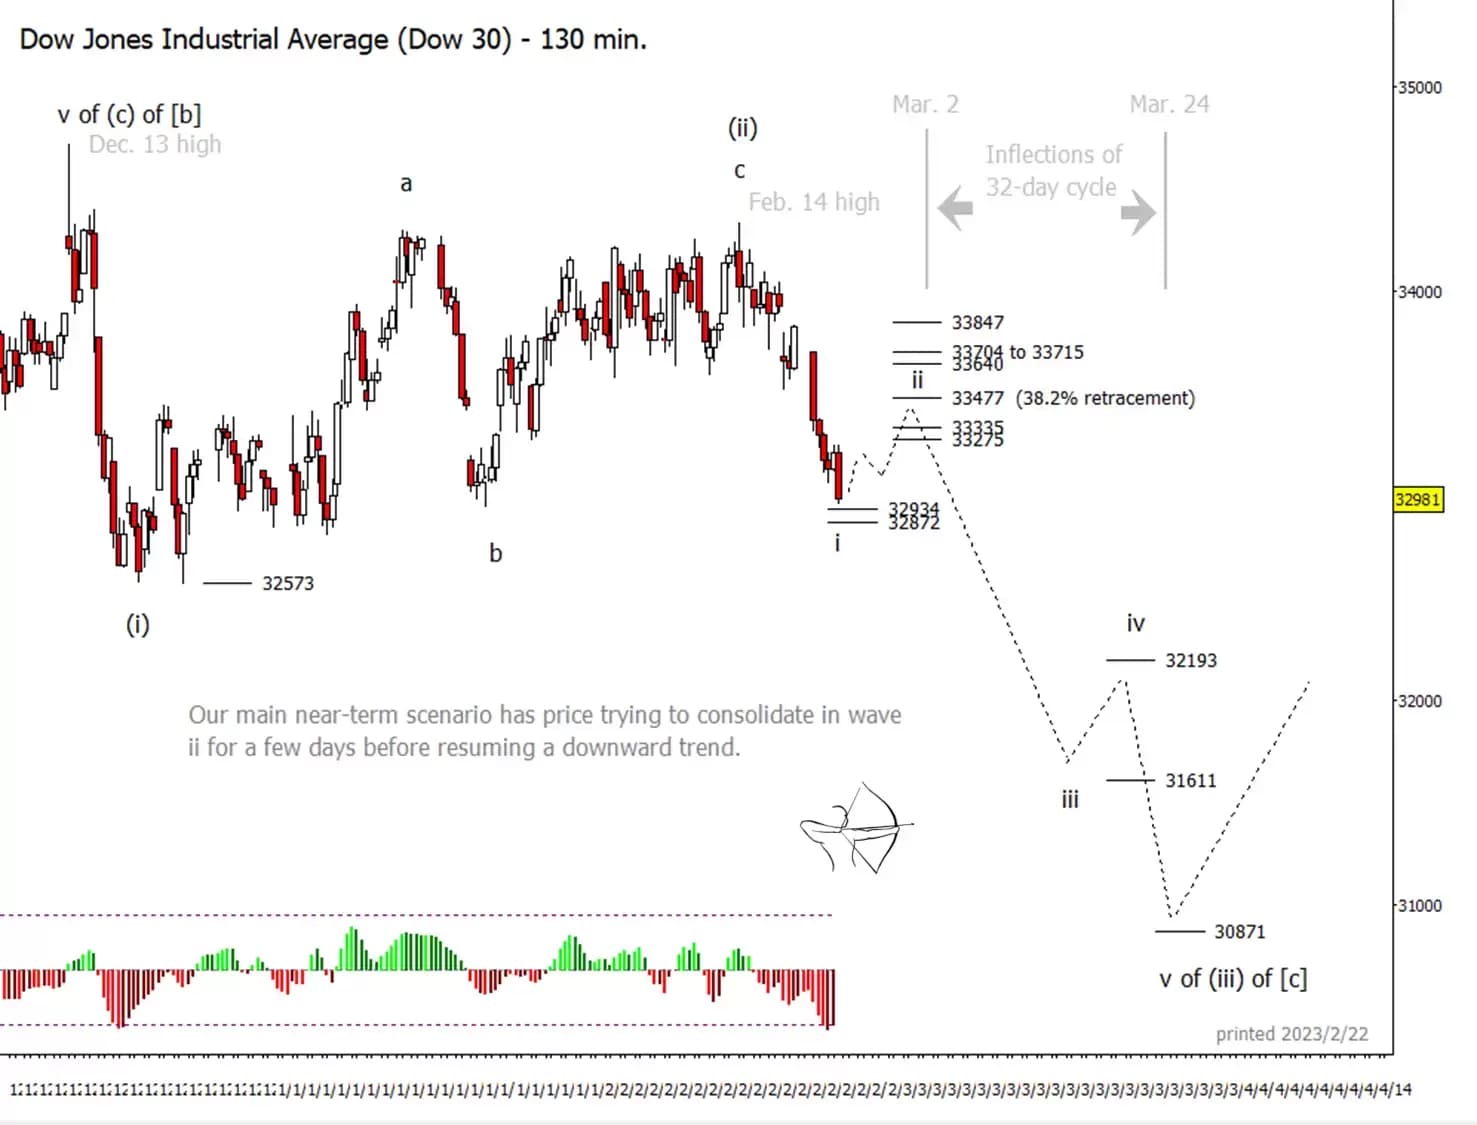
An extreme negative reading on the adaptive commodity channel index (CCI) momentum indicator right now suggests the Dow may be ready for a bounce, or at least a pause in the decline. The test of 32,934 as support on Wednesday may have been enough, but we can't rule out a brief venture lower to 32,872 when the US market opens on Thursday.
Shallow retracement possible for the Dow
The expected bounce/consolidation should appear corrective, which usually means having a three-wave structure. The resistance zone from 33,275 to 33,335 might cap the first part of the bounce, followed soon by an effort to test the 38.2% upward retracement area at 33,477. A deeper (higher) upward retrace is also possible without violating the wave count, but the very negative price action this week, and a pair of unfilled gaps on the index lead us to think market sentiment will favour a shallow retracement.

In particular, watch for the Dow to start accelerating downward if the December low at 32,573 is breached. The next major supports are considerably lower at 32,193, 31,611, and 30,871.
Nasdaq fails to make higher high
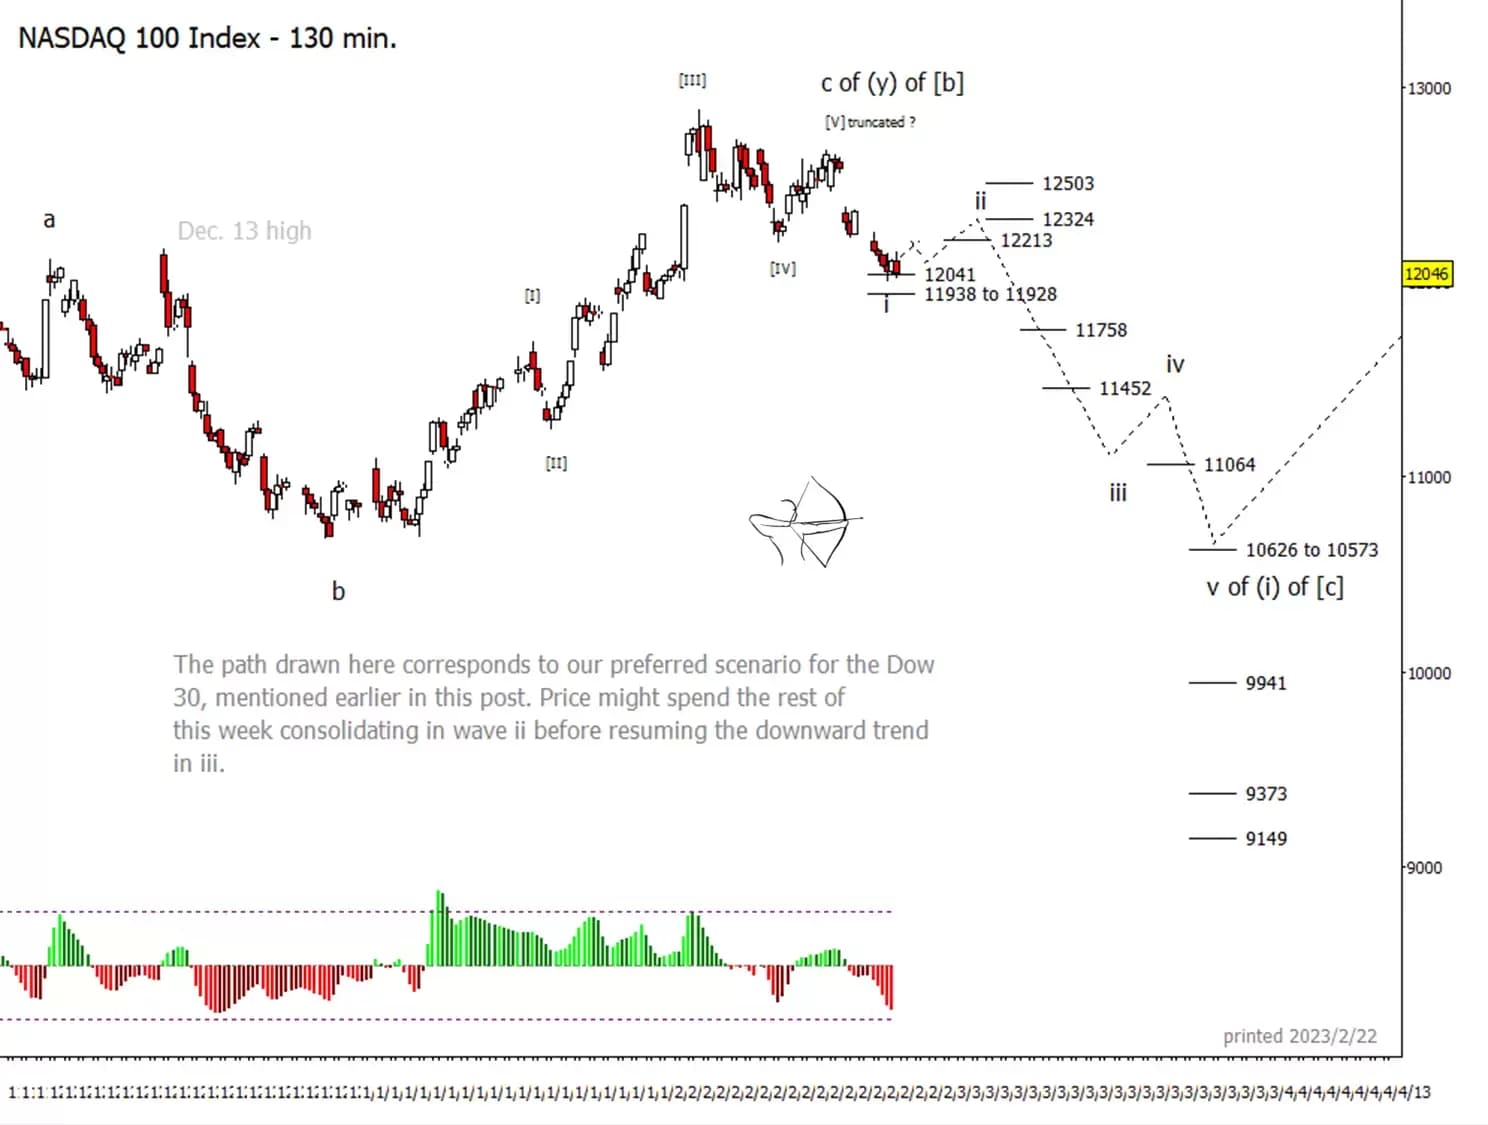
The Nasdaq's failure to make a higher high last week leads us to believe the final upward move may have been truncated. Provisionally we're counting an impulse downward starting from the 15 February lower high. In that scenario, nearby supports at 12,041 or 11,928 could set wave 'i', allowing for a shallow upward retracement to test 12,213 and 12,324 going into Friday and early next week.

We will be able to refine the lower supports shown for the Nasdaq after the expected wave 'ii' high is set.
As for timing, the beginning of March represents a likely window for a cyclic high on several of our daily stock index charts, and we project a corresponding cyclic low around 24 March. We have drawn speculative paths on both charts with that cycle in mind.
For more technical analysis from Trading On The Mark, follow them on Twitter. Trading On The Mark's views and findings are their own, and should not be relied upon as the basis of a trading or investment decision. Pricing is indicative. Past performance is not a reliable indicator of future results.


