Lately, significant moves in the Japanese stock markets and the Japanese Yen shed light on the global economic backdrop. While recession fears mounted in major economies, such as the US, the UK, and the Eurozone, BOJ’s insistence on the ultra-loose monetary policy made the regional market more appealing to stock investors, and the divergence policy stance from its hawkish peers, like the Fed, the BOE, the ECB, and the SNB, triggered a sharp selloff in the Japanese Yen against its peers, such as the US dollar, the British Pound, the Eurodollar, and the Swiss Franc. Despite rising inflationary pressure in Japan, the BOJ may not alter its dovish guidance and will most likely maintain its control of the yield curve by keeping the yield on the 10-year Japanese Government Bond (JGB) under 0.5%.
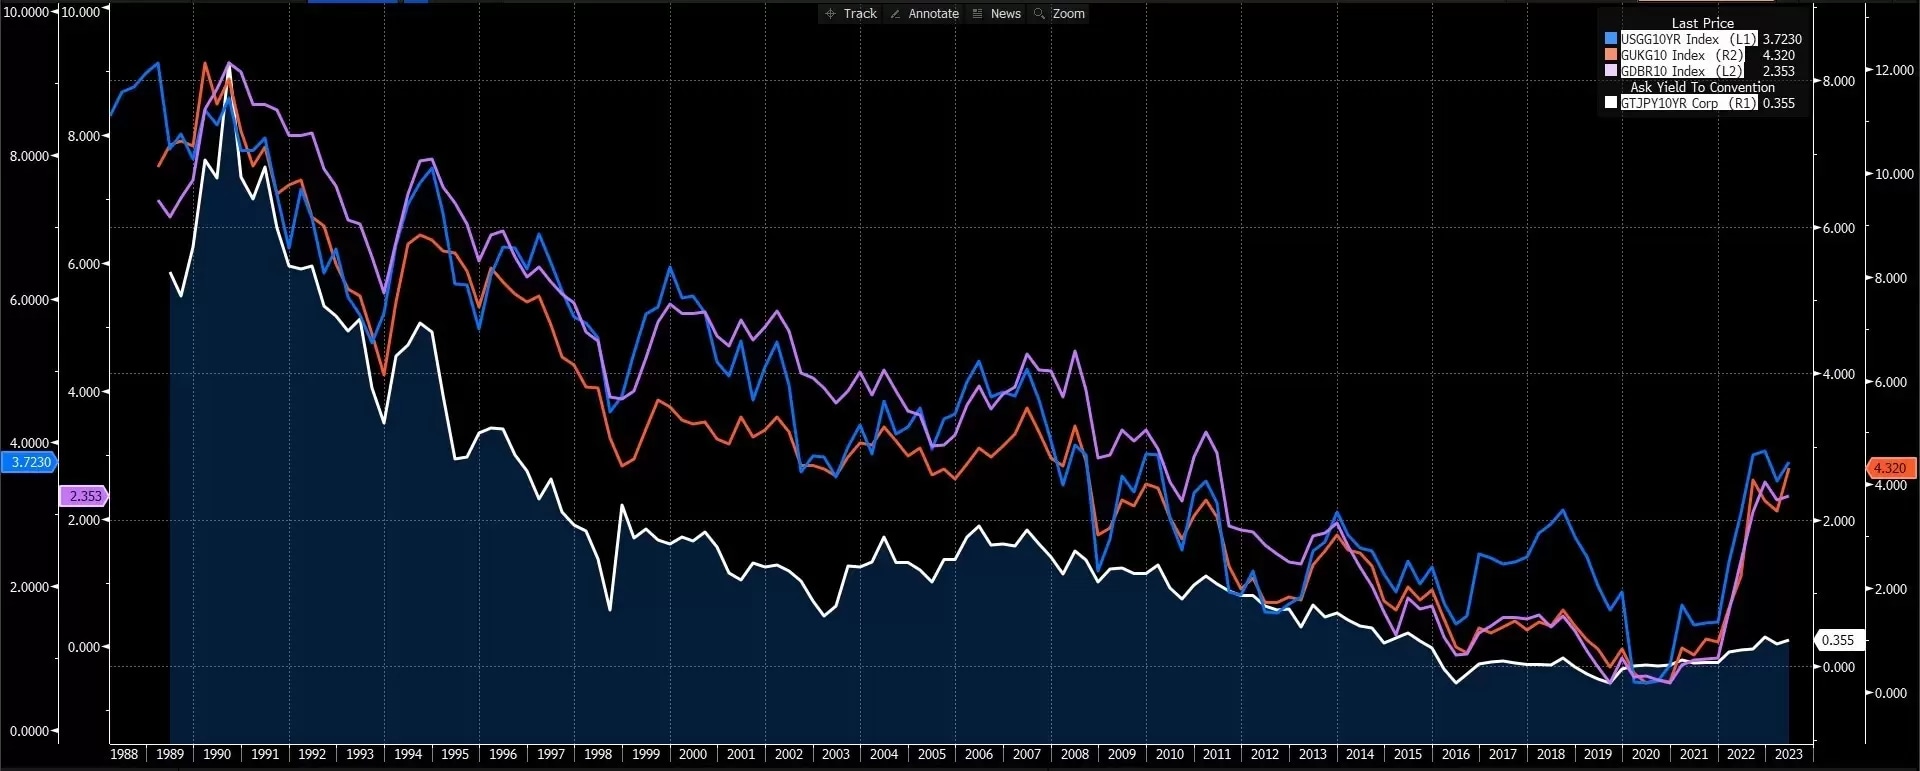
From a tactical perspective, the yield difference between the JGB and other major economic government bonds has been driving the slump of the Yen against other currencies. As shown in the below chart, the yield on the 10-year JGB diverged sharply from other sovereign bonds, the US 1-year bond, the UK 10-year gilt, and the German 10-year Bund since the beginning of 2022, while the Japanese Yen commenced its downtrend from the same time. The trend suggests that the Japanese Yen will not reverse its decline against these currencies until the BOJ changes its policy stance, which may not happen in the near future.
USD/JPY, daily
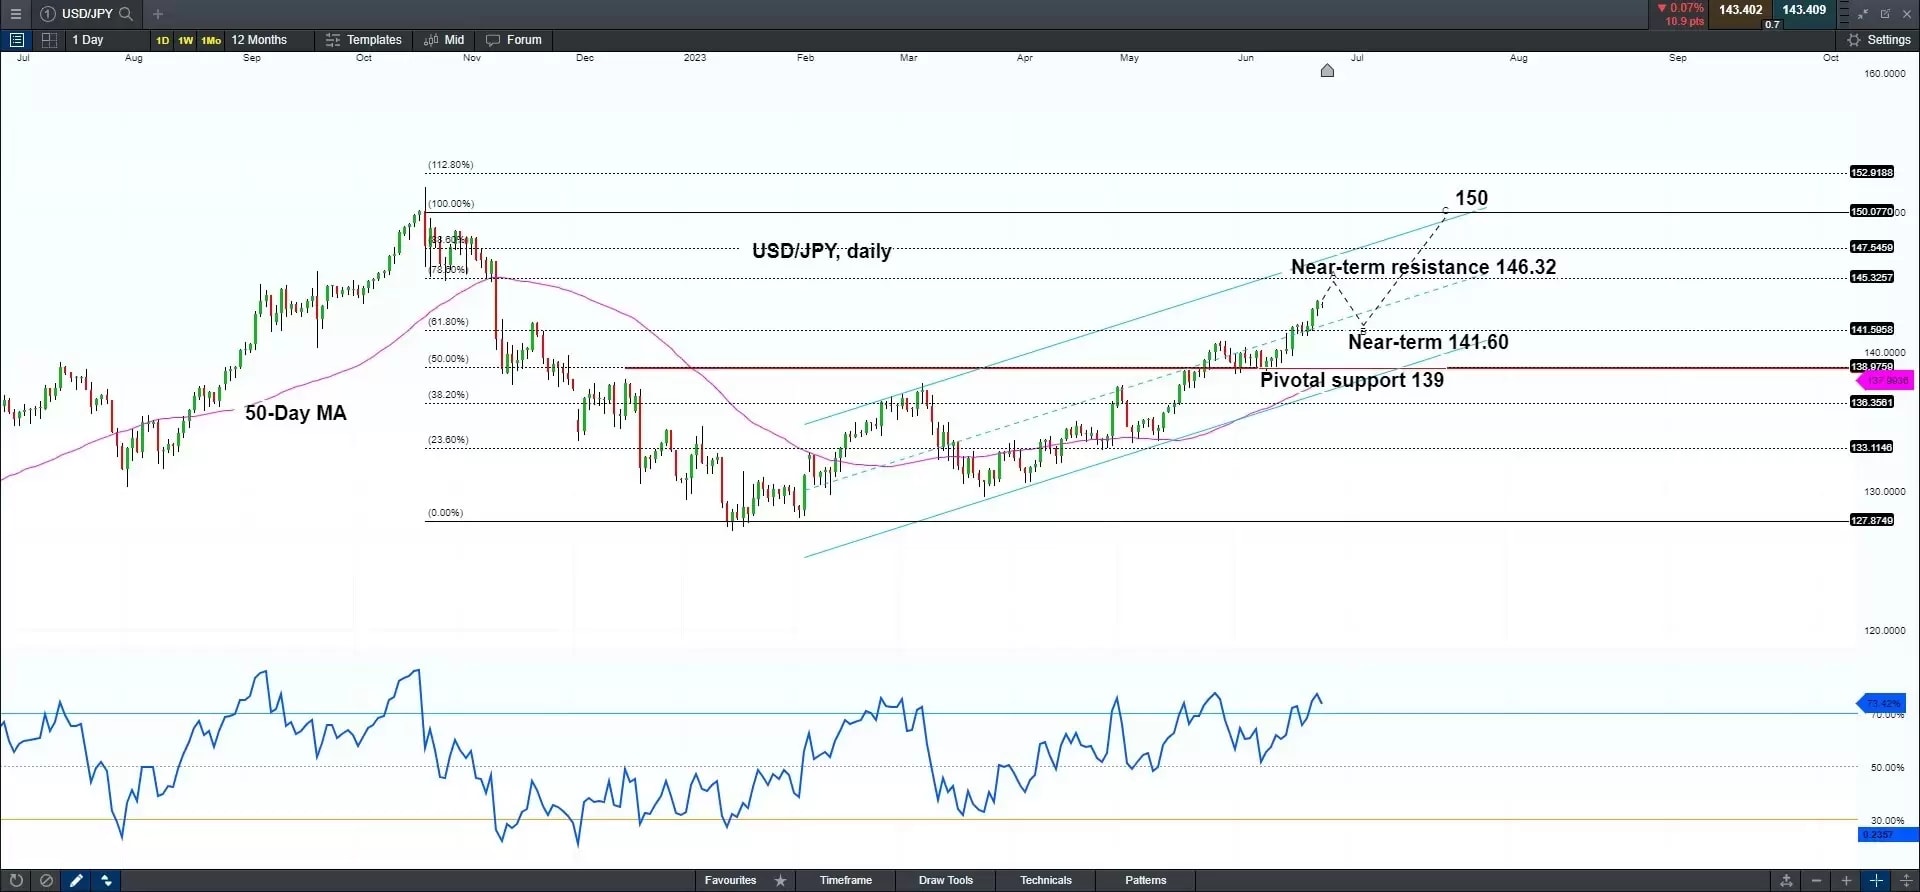
USD/JPY had a major bullish breakout of pivotal resistance of 139 at the 50.0% Fibonacci retracement, suggesting that the upside momentum may continue to take the pair higher. However, an overbought signal in RSI may cause a near-term pullback to test the potential imminent support of about 141.60 at the 61.8% Fibonacci retracement. In the medium term, the descending channel also supports the continuous uptrend movement and may target further resistance at about 146.32, then 150 at the high in October 2022.
On the flip side, a breakdown below of pivotal support of 139 may take the pair to reverse the uptrend.
EUR/JPY, weekly
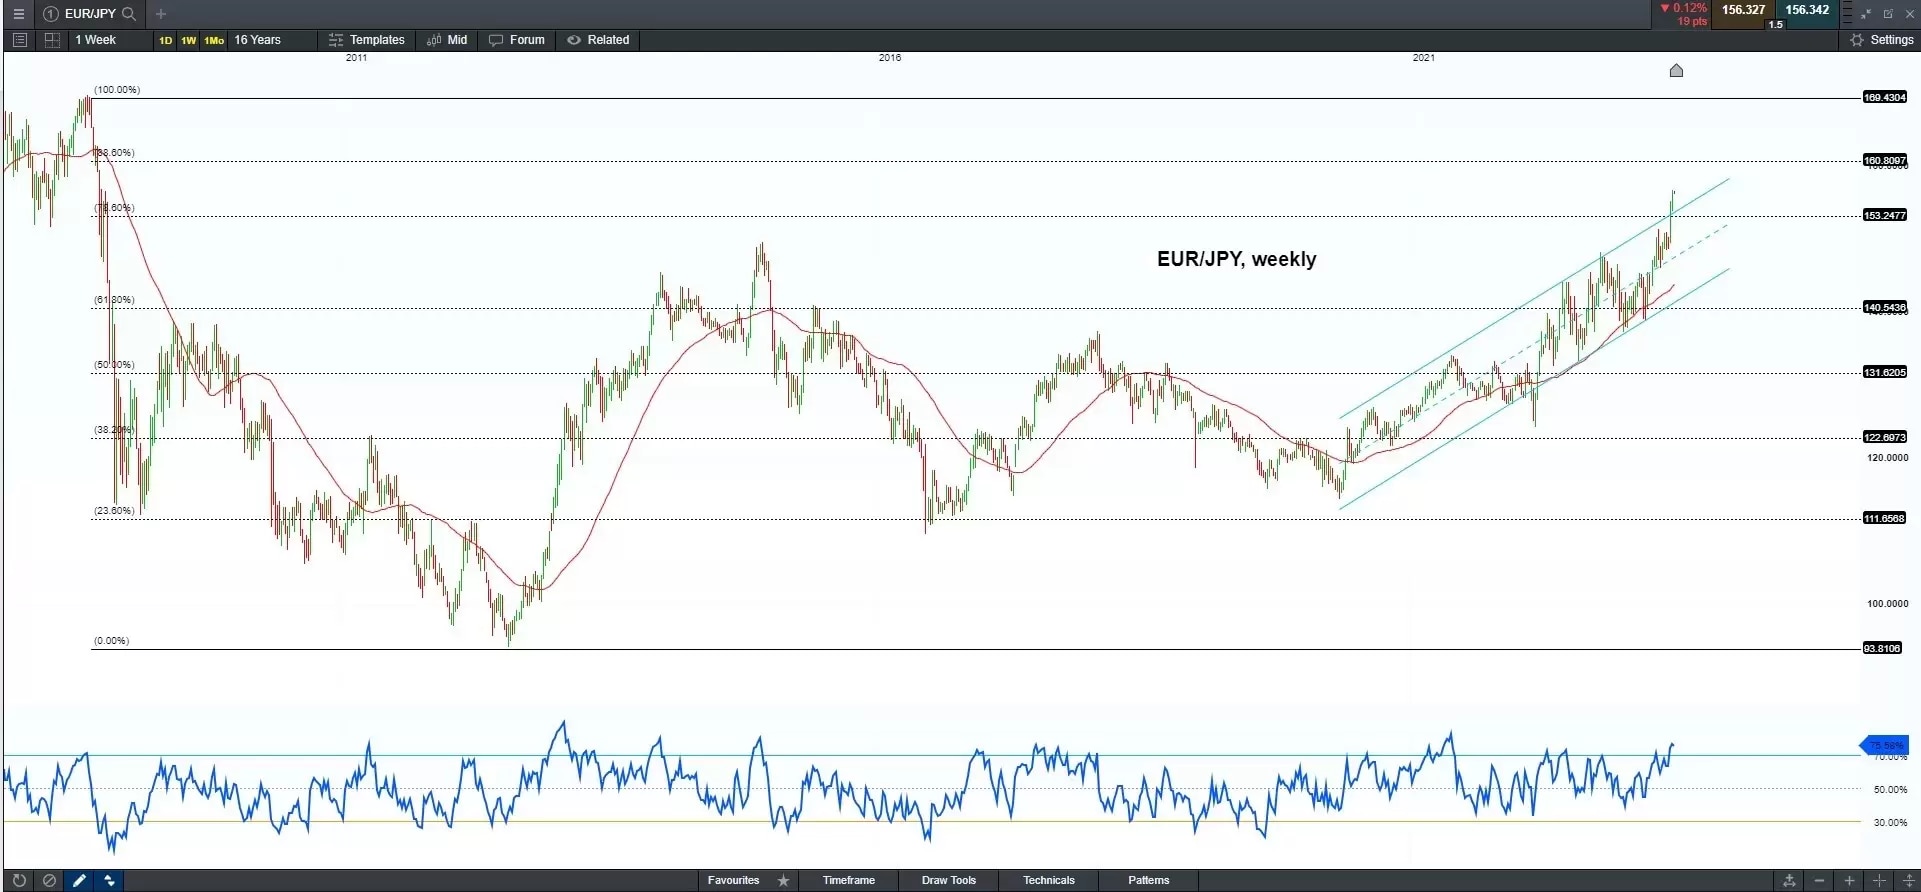
EUR/JPY bullishly broke through the long-term ascending channel last week and may consolidate above the potential near-term support of 153 and head to a possible further long target of about 160.80 at the 88.60% Fibonacci retracement, then above 169 at the high in August 2008.
On the flip side, a breakdown below the near-term support of 153 may take the pair to retreat and test possible further support of 140.55.
GBP/JPY, weekly
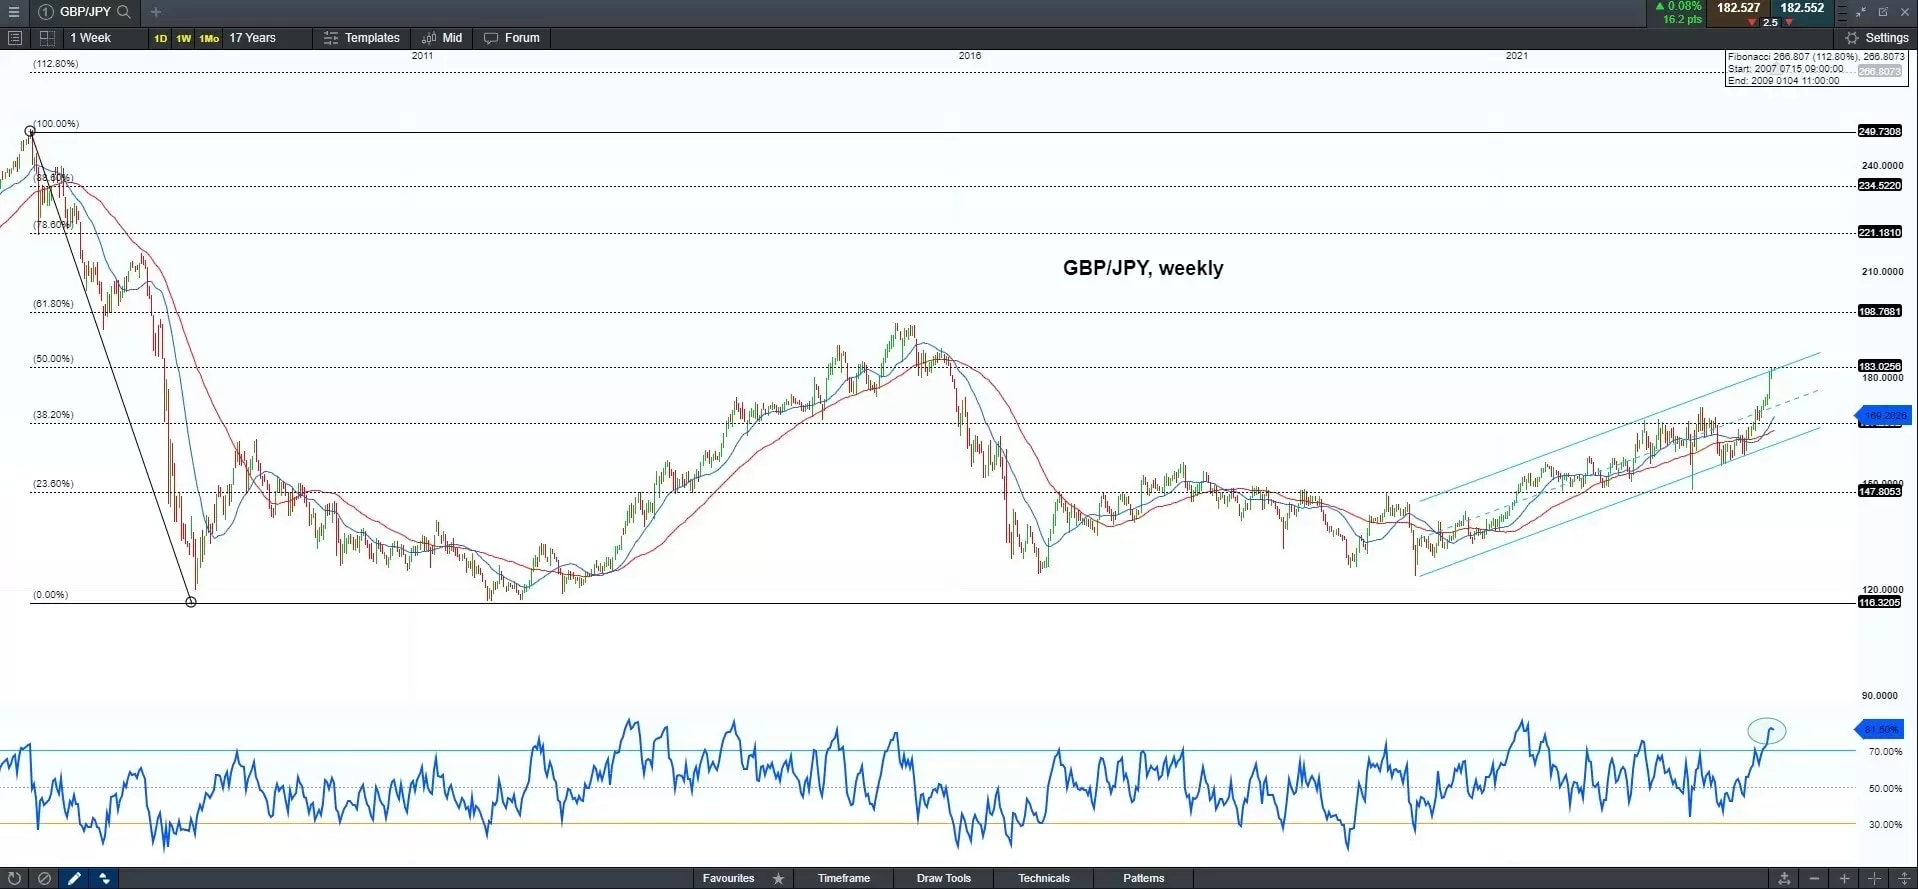
An overbought signal in RSI and channel resistance may cause a near-term pullback in the pair. The potential imminent support could be at the 20-week moving average of about 169.20, then the 50-week moving average of about 165.39. But the uptrend is still intact, suggesting a bullish breakout of the near-term high of 183 may take the pair to head off 194. 90 at the high in June 2015.
CHF/JPY, weekly
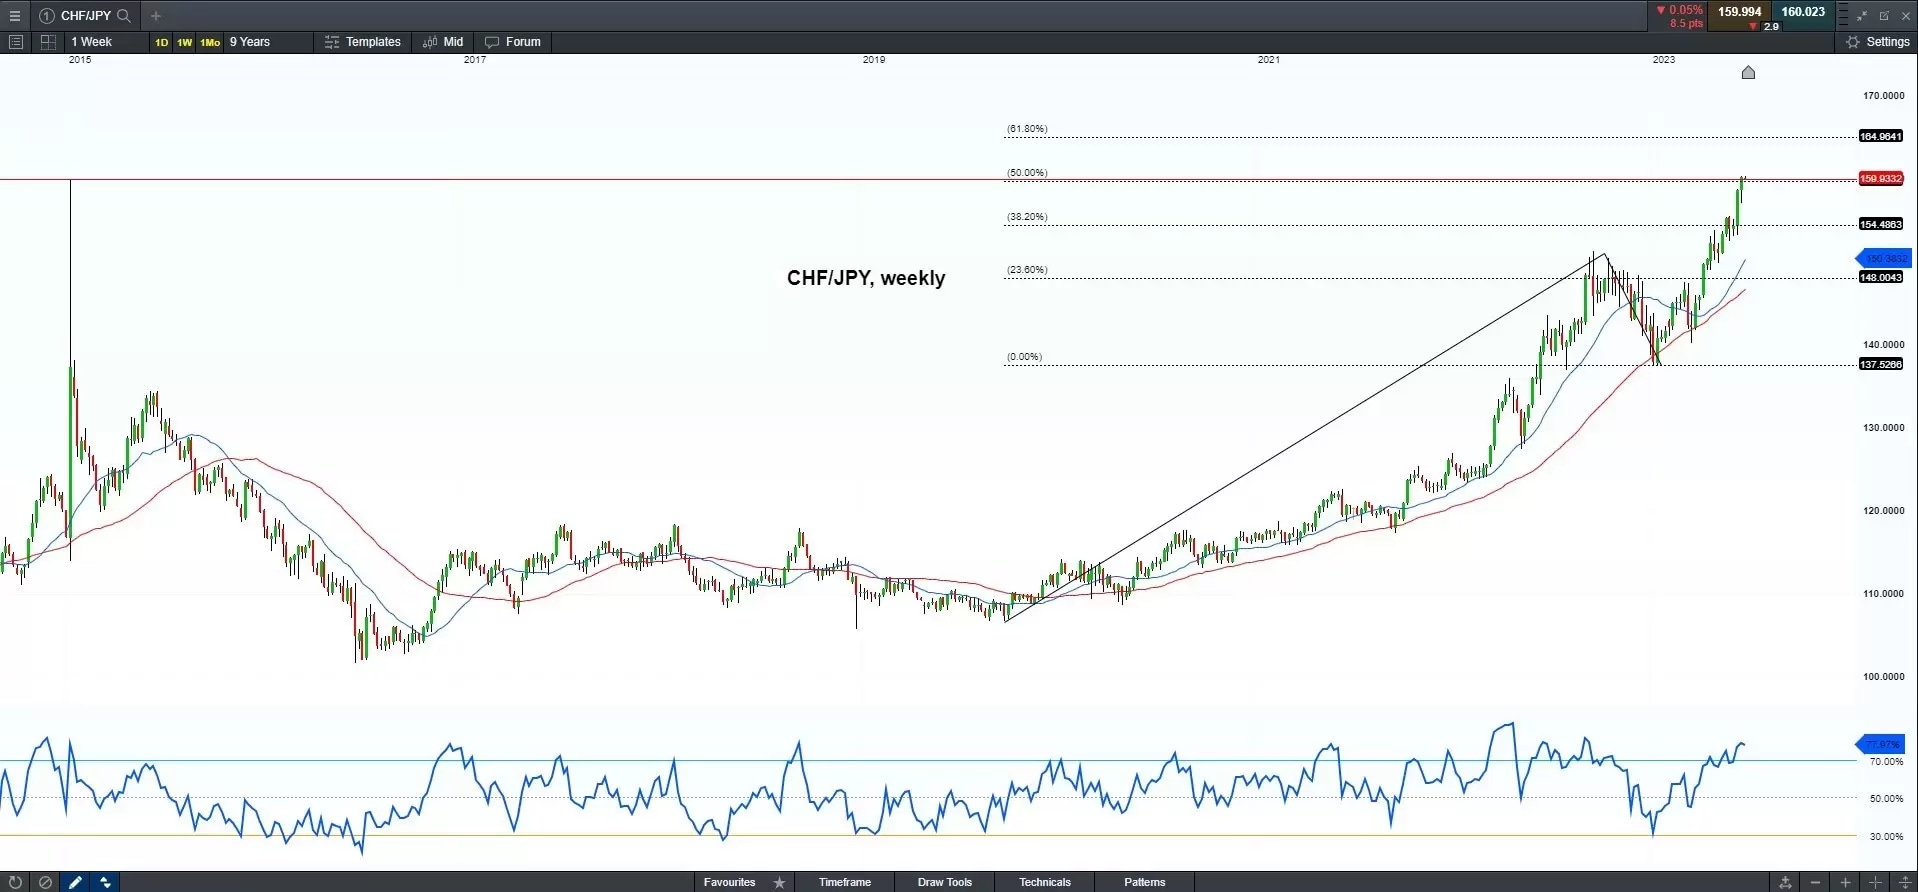
The pair may face an imminent pullback risk at an all-time high level when the SNB scrapped its Eurodollar peg in 2015. And the RSI is also in an overbought territory. The potential near-term support could be around 154 at the 38.2% Fibonacci extension. However, the long-term uptrend may sustain due to the central banks’ divergence policy. A breakout of the recent high will take the pair higher without an in-place l resistance, and the Fibonacci extension points to a potential further long target of 165.


