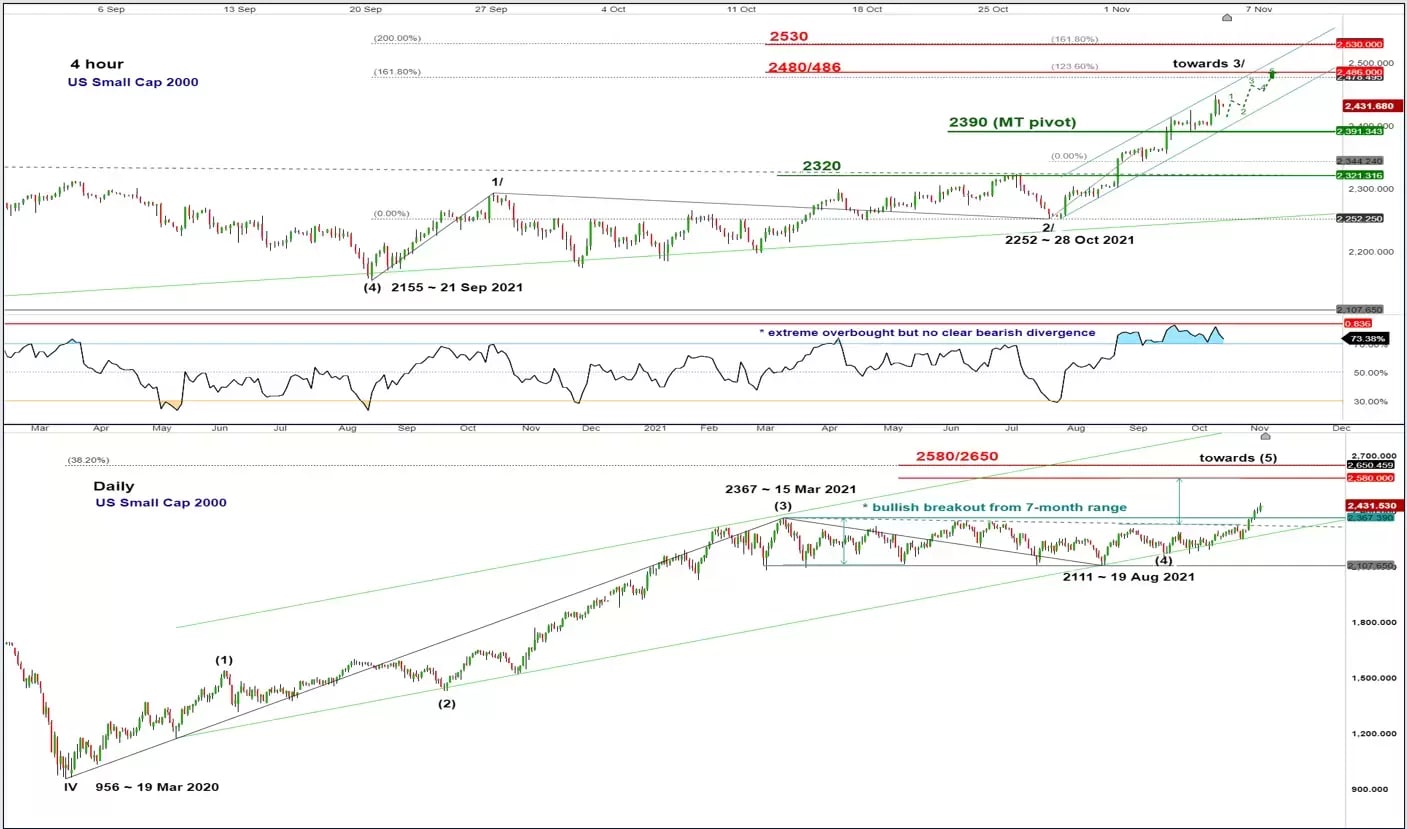
Chart of the week – US Small Cap 2000
US Small Cap 2000 sees further potential up move after major bullish breakout
Short-term technical analysis

Source: CMC Markets
- The US Small Cap 2000 Index (a proxy for the Russell 2000 futures) has finally staged a major bullish breakout from its 7-month plus range configuration last week after it lagged the other major US stock indices since March 2021. Also, it has surpassed its previous all-time high of 2,367 printed on 3 November and ended last week with a fresh all-time closing high of 2,431.
- Last week’s bullish move has indicated that the Index has resumed its medium-term impulsive up move sequence within its major uptrend phase in place since 19 March 2020 low of 956.
- Even though the shorter-term 4-hour RSI oscillator has almost reached an extreme overbought level of 84% but it has not displayed any clear bearish divergence signal yet. In addition, its price action has just broken out of a major (7-month plus) range configuration and its current up move only has a duration of four days from the breakout day on 1 November. Hence, the probability of a multi-week pull-back/consolidation at this juncture is relatively low.
- Watch the 2,390 key medium-term pivotal support (also the lower boundary of a short-term ascending channel from 28 October low) for a further potential up move towards the next resistance at 2,480/486 (upper boundary of the short-term ascending channel & a cluster of Fibonacci expansion levels).
- On the other hand, a 4-hour close below 2,390 negates the bullish tone for a corrective decline to retest the former major range resistance now turns to pull-back support at 2,320 (also close to 61.8% Fibonacci retracement of the current up move from 28 October 2021 low to 5 November 2021 high).


