

Gold surged by more than 15% from its November low to a six-month high due to the sharp decline in the US dollar and the US bond yields in the wake of two consecutive cooling inflation data. China’s reopening optimism has also sparked bullish bets in both industrial metals and precious metals. In the new year ahead, gold may become a major haven asset again as recessionary risks arise. In a weekly view, the strong upside momentum may take gold to test a further pivot resistance of 1,900 again. However, an imminent pullback may occur from a technical perspective.
Gold (cash), daily (Facing a near-term channel resistance)
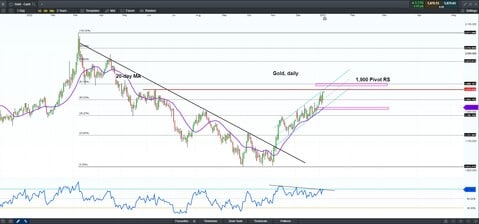 Source: CMC Markets as of 9th, Jan (Click to enlarge the chart)
Despite strong bullish factors in gold, the precious metal may face a short-term pullback risk from a technical perspective. In the daily chart, gold has been moving in an ascending channel since late November, facing an imminent resistance of 1,877, which is the high seen on June 13. The near-term support may confluence with the 20-day moving average, pricing between 1,800-1,815.
In addition, the uptrend in gold is forming a potential bearish divergence with the RSI, which is on its downtrend from the overbought territory, again suggesting the upside momentum in gold might be exhausting.
On the flip side, a breakout of the pivot resistance of 1,900 might take gold to spike further to reach the next resistance of about 1,973.


