Chart of the week – Gold
Potential bullish reversal for Gold
Short to medium-term technical analysis

Source: CMC Markets
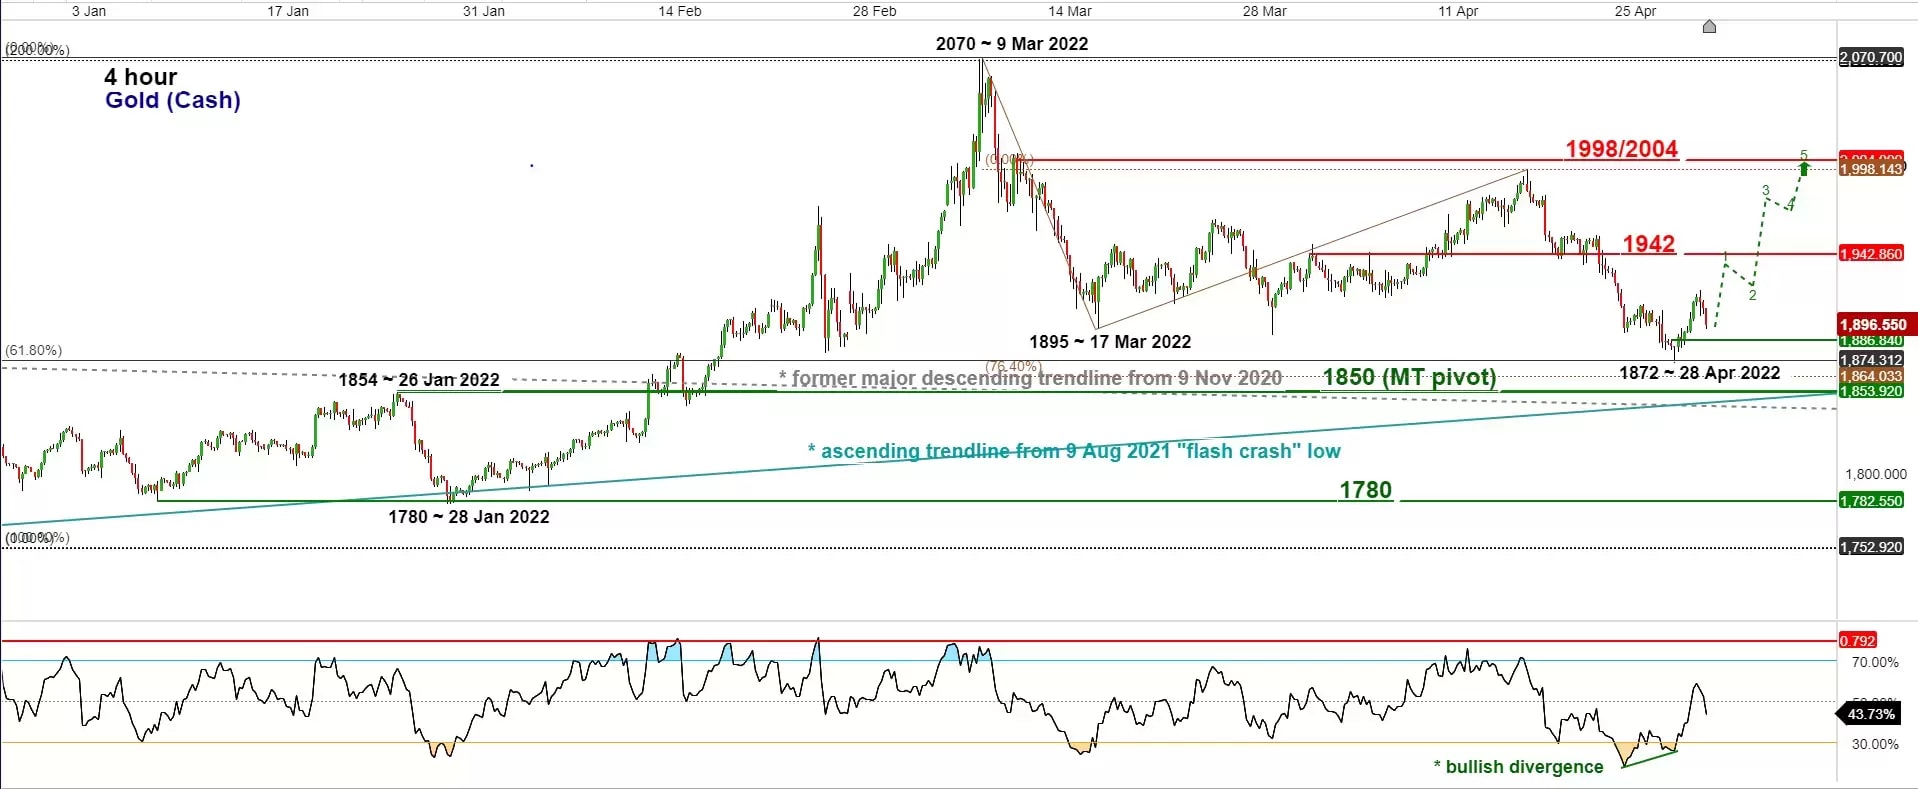
- Watch the 1,850 key medium-term pivotal support on Gold (cash) for a potential recovery to retest 1,942 intermediate resistance and a break above it opens up scope for a further up move towards 1,998/2,004 next. On the other hand, a break with a daily close below 1,850 put the bulls on hold for an extension of the corrective decline within its longer-term major uptrend phase towards the next support at 1,780 (swing low areas of 7 January/28 January 2022).
- The price actions of Gold (cash) have staged a decline of -6.3% in the last two weeks from 18 April 2022 high of 1,998 to print an intraday low of 1,872 on 28 April 2022.
- Interestingly, the recent bout of weakness has led its price actions to drift down close to a significant inflection/support level zone of 1,870/1,850 which confluences with several key technical elements.
- The significant support level zone of 1,870/1,850 is defined by the ascending trendline from 9 August 2021 “flash crash” low, former swing high of 26 January 2022, 100-day moving average, 61.8% Fibonacci retracement of the up move from 16 December 2021 low to 9 March 2022 high and the 0.764 Fibonacci extension of the recent decline from 9 March 2022 high to 17 March 2022 low projected from 18 April 2022 high.
- The 4-hour RSI oscillator has flashed a bullish divergence signal at its oversold region which suggests that the downside momentum of the recent decline from 18 April 2022 high has abated, and it increases the odds of a short to medium-term recovery process in price actions.


