Oil prices fall on news that OPEC may cut Russia out of the output alliance amid an EU ban on Russia’s 90% exports, which could cause Russia to substantially reduce its oil production. According to Financial Times, Saudi Arabia indicated raising output to compensate supply shortage in Russia. The OPEC + will meet later today to discuss the joint output plan for next month. Traders took profit on the recent price rally and expect a potential material impact on the oil markets if the alliance confirms an output increase.
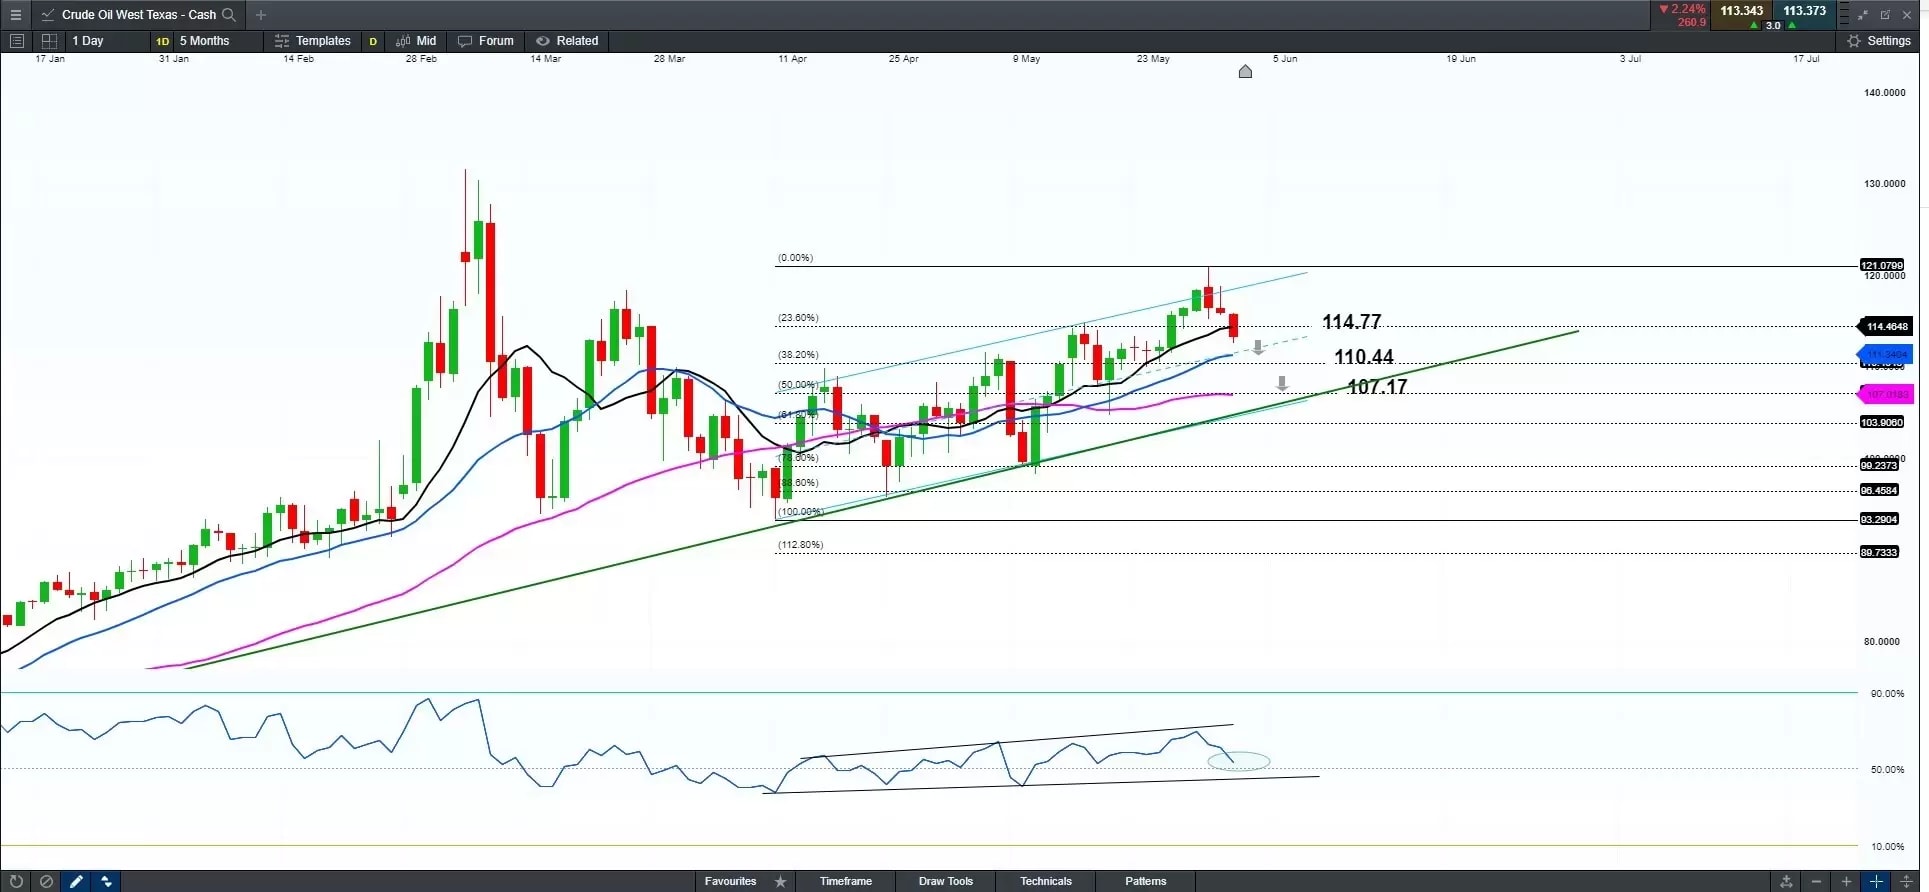
Chart 1 – Crude Oil Texas – Cash, Daily (CMC Markets NG)

From the above chart, oil retreated from the recent high at above 120, falling off the channel resistance, and heading to the 20-day MA at around 110.40 -111.36. The bearish fundamental factor may continue to send the oil price even lower to test further pivotal support at 107.17, the 50-day MA, also the long-term ascending trendline support. The short-term day resistance is at the 10-day MA, around 114.50. But we cannot confirm a major bearish breakout to the long-term descending trendline just yet, it all depends on how the macro picture plays out.
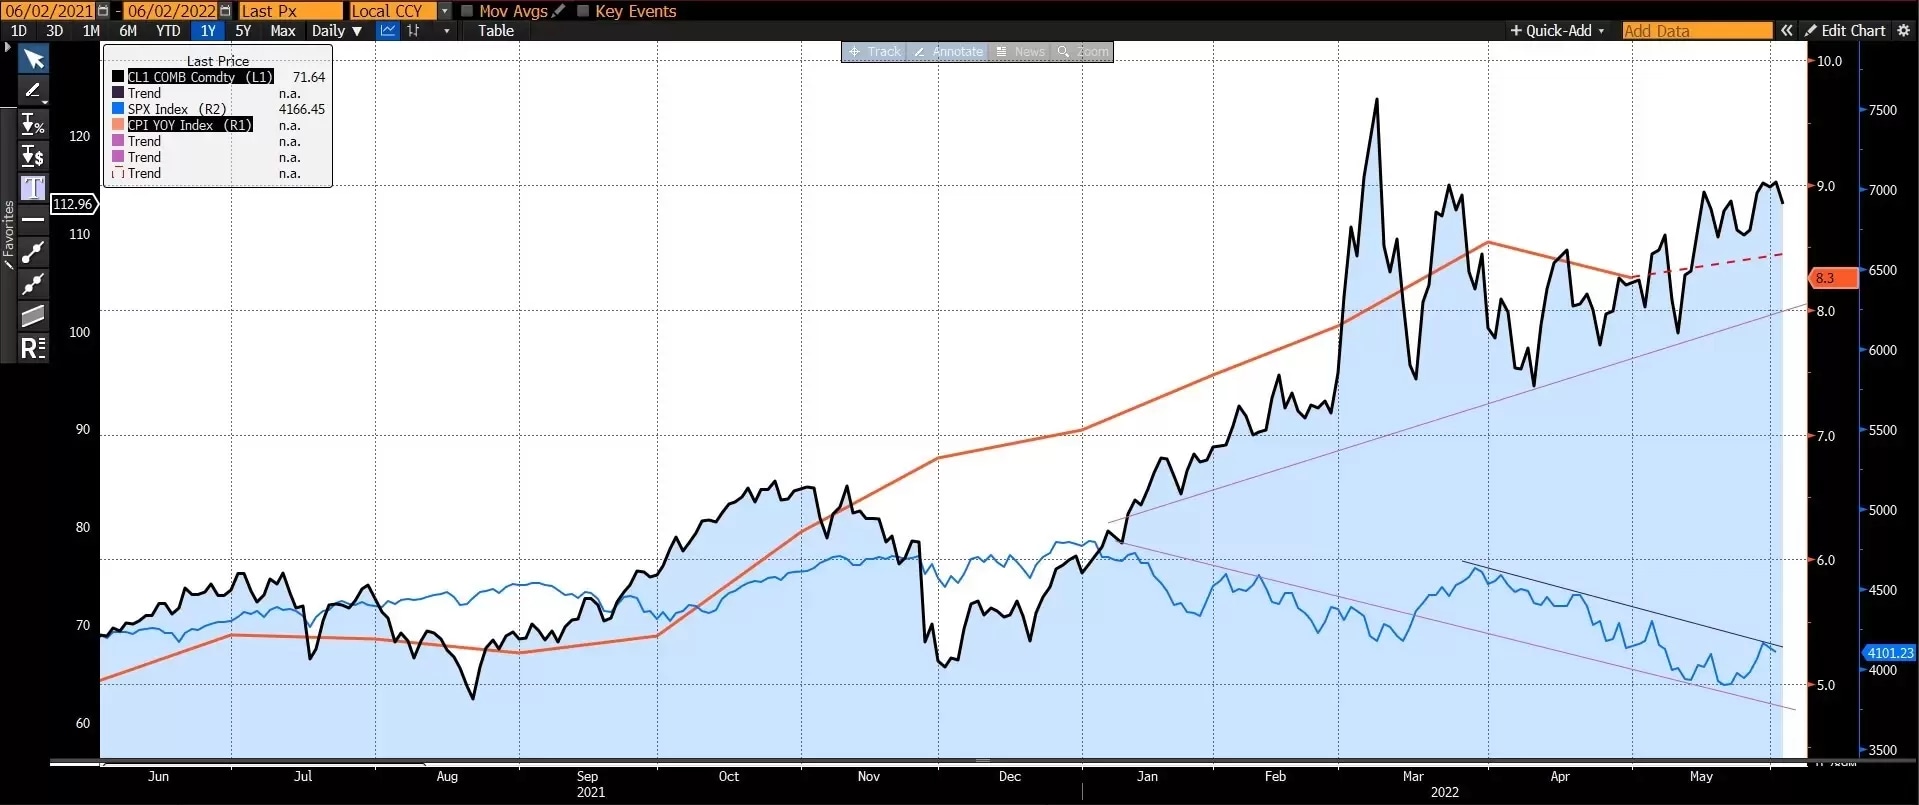
Chart -2 COMB WTI Futures (Black line) vs. SPX Index (Blue Line) vs. US CPI YOY Index (Red Line) 1 year

Oil price plays a major role in the global inflation story, sending US CPI to a 41-year high at 8.5% in March but moderated since. From the correlation among the three data (YTD trend), the US CPI may continue to elevate in May but is most likely to support a peaking inflation theory, which will be released on Friday next week. The S&P 500 is now testing the descending trendline at 4,160, suggesting it may have a major bullish breakout if oil price substantially falls. From the short-term technical perspective, if S&P 500 can close above 4,100 tonight, the directional bias will pro the upside and support a medium-term rebounding of the index, to the next resistance at 4,300.


