


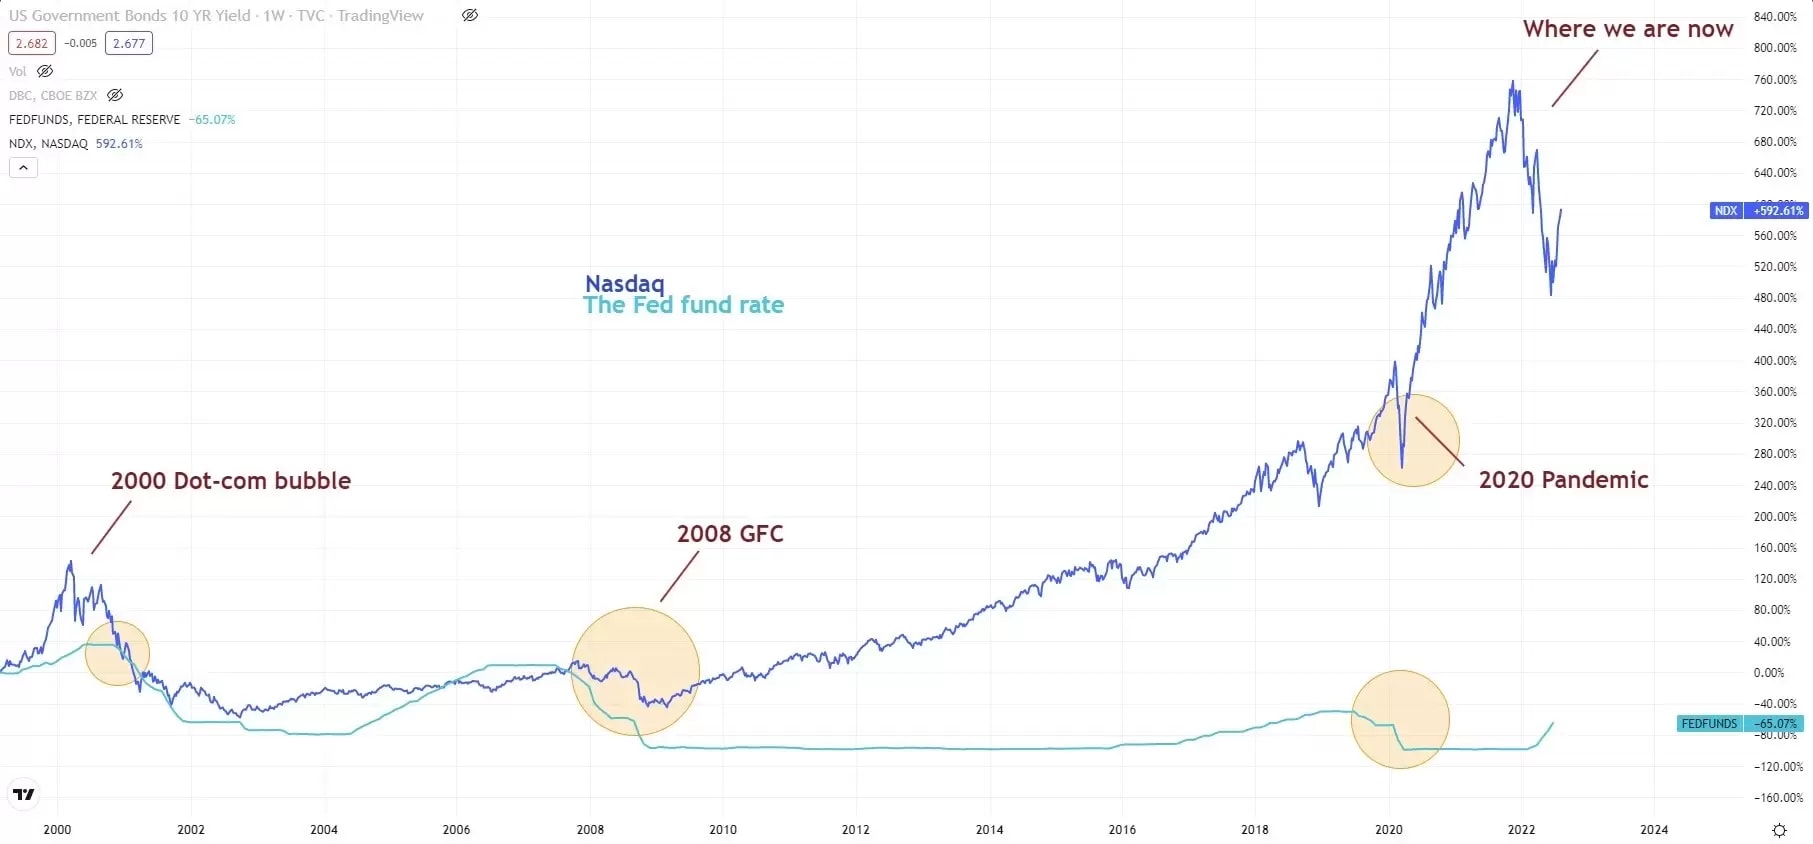
The cooler-than-expected CPI data sent broad markets higher on Wednesday. Wall Street continued the recent rally as the data confirms a “Fed pivot” no matter if it is a 75 basis point or a 50 basis point, which all marks a slowdown in rate hikes. A bear-mark rally usually happens during the peak in a rate hike cycle and the real crash often occurs halfway through the rate cut cycle as seen in the below chart.
Based on the above conclusion, the US equities are still on a course of a “Fed pivot” relief rally. Nasdaq rebounded nearly 21% since the year-low seen in mid-June, now the index is about 18% down year to date. The rebounding tailwind could take the tech-heavy index to rise by another 10-12% toward 15,000 if the Fed is in line with the market’s expectations.
Nasdaq, daily (1-2months)

Nasdaq had a major bullish break out on the descending trendline yesterday. The upside momentum may take the index to rise toward the resistance around Fib. 50% retracement, near 14,000, confluence with the 200-day MA. However, the overbought indication in the RSI may soon cause a retreat and test the potential near-term support of around 13,000.
On the flip side, a breakdown of the support at 13,000 may reverse the rebound trend and take the index re-test further support at 12,360.


