I CFD sono strumenti complessi e presentano un rischio significativo di perdere denaro rapidamente a causa della leva finanziaria. Il 72% di conti di investitori al dettaglio perdono denaro a causa delle negoziazioni in CFD con questo fornitore. Valuta se comprendi il funzionamento dei CFD e se puoi permetterti di correre questo alto rischio di perdere il tuo denaro.

Using trendlines in technical analysis

Trendlines are used in technical analysis to define an uptrend or downtrend. Traditionally, uptrend lines are made by drawing a straight line through a series of ascending higher troughs (lows).

Prova ora la tua strategia forex!

Utilizzando la nostra piattaforma Next Generation o MetaTrader4, puoi testare la tua strategia forex senza rischi con fondi virtuali, tutte le volte che vuoi.


A trendline could also be called a ‘trend support line’ because it shows the direction of a trend, and it acts as a support line.

With downtrends, trendlines are formed by drawing a straight line through a series of descending lower highs. The charts below are examples of down and up trendlines. It's usual practice to join the highs or lows (wicks) of the candlesticks and not the closing prices.

Uptrend and downtrend examples

Trading di CFD con un broker pluripremiato*

Prova il trading di CFD gratuitamente
e senza rischi con il nostro conto demo.

Common trendline and channel rules

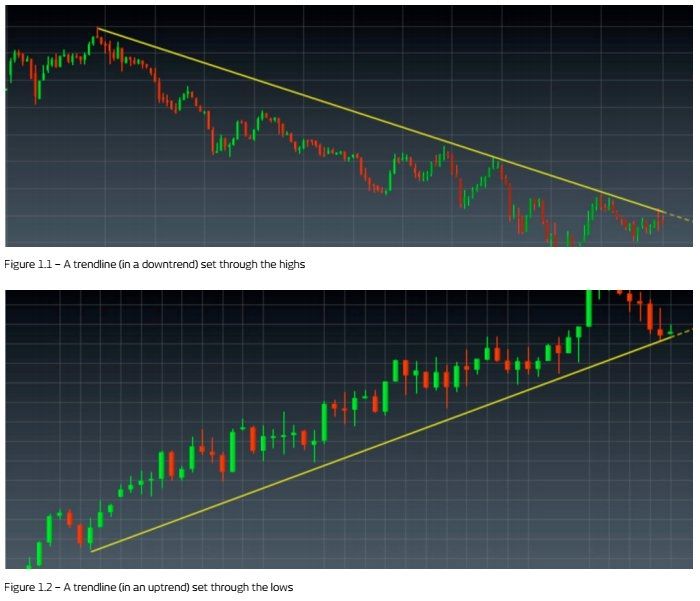
These two rules are usually applied to trendlines and channels:

  1. Declines in price that approach an uptrend line, or price rises that approach a downtrend line, can be good opportunities to initiate positions in the same direction as the trendline.
  2. The penetration of an uptrend line, particularly on a closing basis, is a sell signal, and the penetration of a downtrend line is a buy signal. Normally, analysts apply a minimum percentage price move (1% breach on a stock for example) through the line or a minimum price move.

According to the first rule, as price approaches an uptrend line, the trendline (if it's a valid one) tends to act as a support, so one could buy as price approaches the line. The line must not be breached. If a trendline is cut through, then we can say in effect that a support has been breached and we could act as we would if it were a normal support break.

Conversely, downtrend lines tend to act as resistances. One could sell as the price approaches the line — again it must not be breached. In the chart immediately below, you will notice our entry points would be chosen with this in mind, providing 'cheaper' buy-in levels in an uptrend, nearer the trendline; and in a downtrend, providing higher levels to sell into a downtrend.

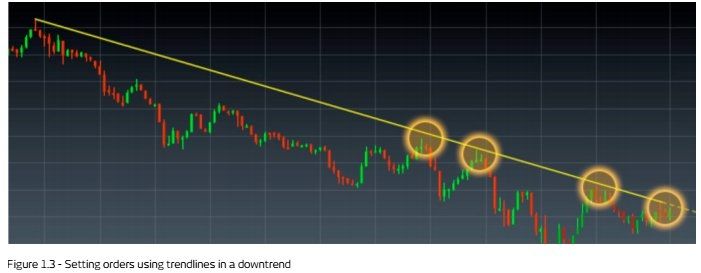
The 'sell' points in the above chart represent the ideal 'sell' orders, which would tend to cluster near and underneath a downtrend line. The reason they have to be underneath and not above, is that a downtrend line acts like a resistance line. Price action above the line would, by definition, be a 'technical break' over the line, which would mean a trader could expect a short-term spike, so could be looking to exit short trades rather than enter them.

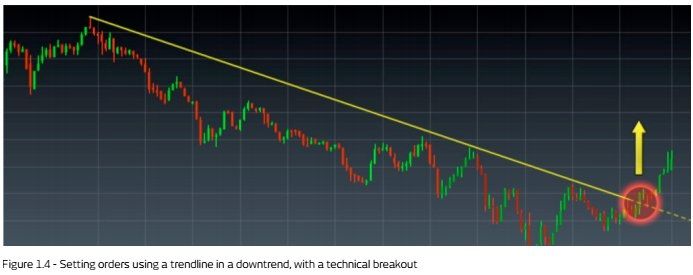
In this chart, you can see an example of a downtrend and trendline for most of the chart, with the ideal selling points (shown by the trendline) throughout the course of the downtrend. Then, as all good trends do, the trend comes to an end with the break of the downtrend line and resultant short-term spike that follows.

Our charting features within the Next Generation trading platform enable you to draw your own trendlines. Find this capability in the drawing tools section of the chart function.

Redrawing trendlines

Changes in trend speed may necessitate the redrawing of lines. This is particularly important if they are breached temporarily, only to resume the trend, as this could make the lines themselves unreliable.

​While penetrations of trendlines often warn of a trend reversal, a breach usually also means you will need to redraw a trendline, as shown by the chart above. It's not enough to show a trendline that works — it's important that the trend method also works.

CMC Markets è un fornitore di servizi di sola esecuzione. Queste informazioni (che contengano o meno opinioni) hanno solo scopo informativo e non tengono conto delle circostanze o degli obiettivi personali dell'utente. Nessuna delle informazioni contenute in questo documento è (o dovrebbe essere considerata) una consulenza finanziaria, di investimento o di altro tipo su cui si può fare affidamento. Nulla nei documenti costituisce una raccomandazione da parte di CMC Markets o dell'autore secondo cui un particolare investimento, titolo, transazione o strategia d'investimento sia adatto a una particolare persona. I materiali non sono stati preparati in conformità con i requisiti di legge volti a promuovere l'indipendenza della ricerca di mercato degli investimenti. Sebbene non sia espressamente vietato a noi trattare prima di fornire questo materiale, non cerchiamo di trarne profitto prima della sua diffusione.


Fai trading di CFD con CMC Markets in 3 passi

1

Invia richiesta

Completa il nostro semplice modulo di candidatura conto.

2

Deposita

Finanzia il tuo conto tramite bonifico bancario, carta di credito o PayPal.

3

Fai trading

Dopo aver finanziato il tuo conto, puoi iniziare subito a fare trading.

Prima di partire...

Prova il trading di CFD sulla nostra innovativa piattaforma con un conto demo. Gratis e senza rischi con un capitale virtuale a partire da 10.000€.

cmc-mobile-trading-app