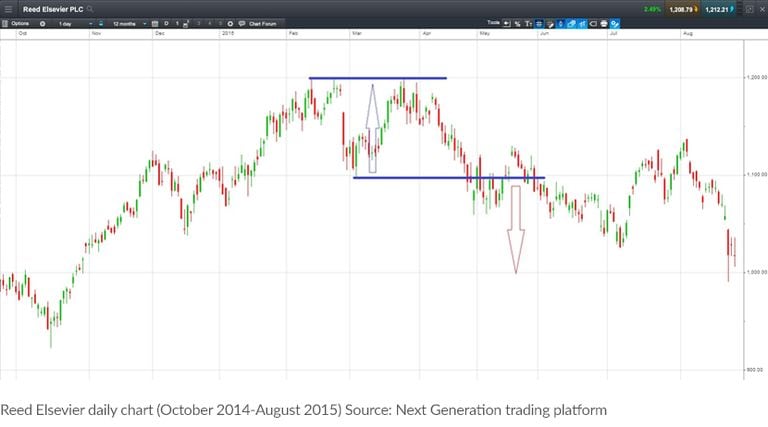
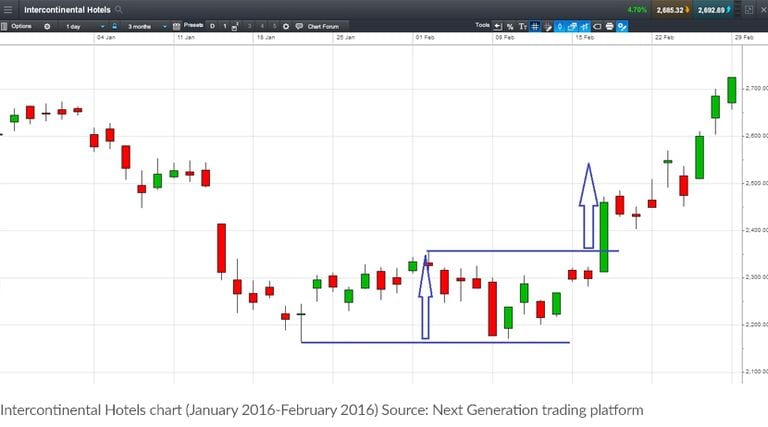
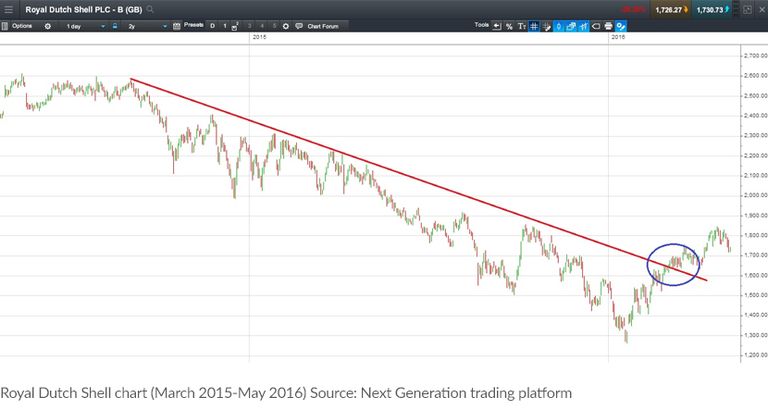
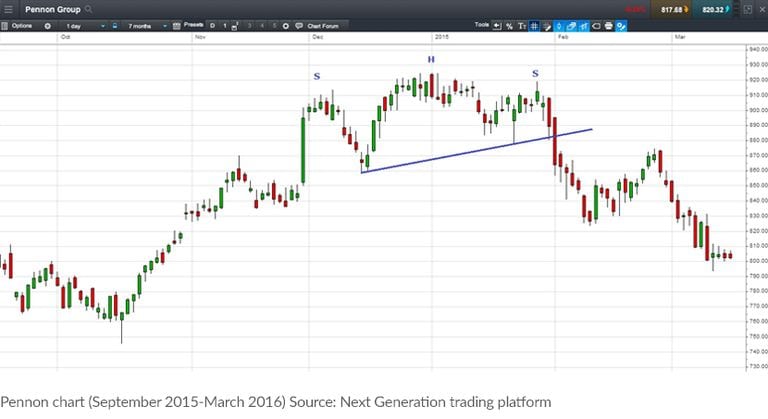
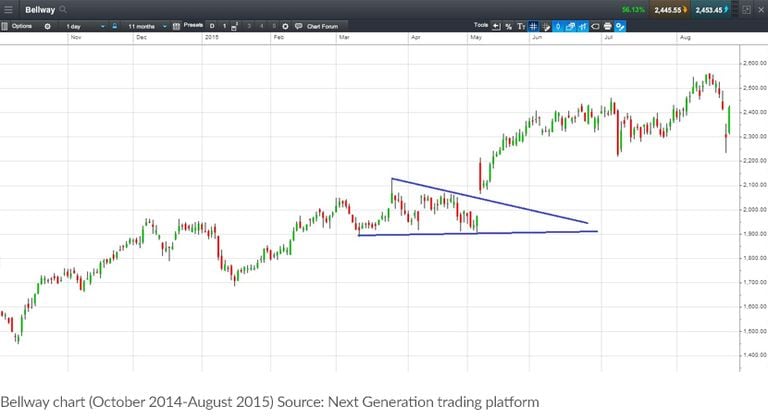
A part of technical analysis, chart pattern analysis can help traders to predict the future direction of the markets and spot potential trend reversals based on historical price data. Common chart patterns include triangles, double tops and bottoms, head and shoulders, flags, pennants and wedges. Some traders look at price charts to complement their fundamental research on what to buy and when, while others make decisions based solely on what the charts are telling them.
In this article we take a look at five influential stock chart patterns that can be a powerful addition to your strategy, no matter which approach you take to trading the markets.
