Morningstar quantitative equity research reports are available for most of our global spread betting and CFD shares. The reports present all the current cash fundamentals for a share, along with a series of value estimates, to reveal what the share could potentially be worth versus its current underlying price.
Video transcript
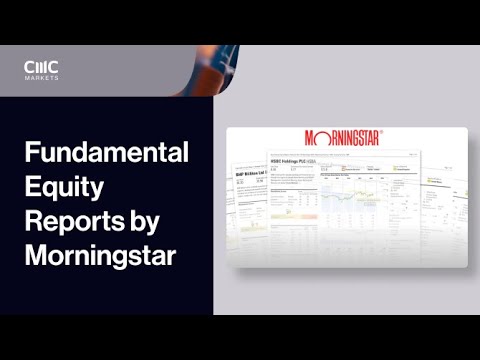
To support our CFD and spread bet share offering, the Next Generation platform includes fundamental equity reports powered by Morningstar. These comprehensive reports are updated daily and provide you with unique insights into the quantitative financial health, valuation, uncertainty, and the Morningstar analysts' Fair Value Estimate on thousands of shares offered on our platform. The report provides up to five years' worth of historical financial data, profitability ratios, and dividend information that can help you analyse the financial health of any company. To access the Morningstar Quantitative Equity Reports for a company on our platform, you must be a live Next Generation account holder. You can access Morningstar Reports through any share product's context menu in the Next Generation web platform. Or via the product's factsheet on our mobile apps. If you are accessing a Morningstar Report for the first time, you must carefully read and accept the disclaimer before you can view the report. Morningstar's Quantitative Equity Reports collate and statistically analyse all the relevant data around a company's financial figures and performance. The report is broken down into five main sections. The report header includes a brief description of the company, its relevant sector and industry, current market cap, last underlined close price, and Morningstar's unique Quantitative Fair Value Estimate. Morningstar's Quantitative Fair Value Estimate is one of the most useful numbers on the report, as it suggests whether the share may currently be undervalued or overvalued, and therefore the potential future direction of price movement. The Fair Value Estimate is Morningstar's statistical estimate of what the share price should be today. This Quantitative Fair Value is then plotted against price action along with the yearly total return, monthly volume, and dividend data to provide an overall picture of the share's current price versus analytical and fundamental data. The display chart will also provide a forecast price range based on Morningstar's Fair Value Estimates. In addition to the Fair Value Estimates, Morningstar also provides a number of other quantitative scores, including company valuation, economic moat, financial health, and quantitative uncertainty. For a full detailed description of each of these ratings, please see our website. These scores are then compared with relevant benchmarks including sector and country to help you determine the financial strength of the company compared to immediate competitors and local markets. To help Morningstar calculate the quantitative values, historical fundamental data is used. The most important historical fundamental data is shown here. It includes the last five years' revenue, operating income, earnings and dividends per share, book value, and profitability ratios, such as return on equity and gross margin. The reminder of the left-hand column provides you with further information around valuation, probability ratios, financial health, and growth per share. This section also contains a chart showing a company's quantitative moat, which is the company's competitive advantage, so you can easily say if any advantage is still prevalent, has eroded over time, or is growing. These in-depth reports are available across our entire CFD and spread bet share offering, providing you with access to the most relevant fundamental data and quantitative analysis. It's important to note that quantitative research is automated and uses a universal rule-based metric system to generate all value estimates. This service is not providing tailored advice or personal analysis, it is merely providing a simplistic yet effective summary of the latest data releases impacting each stock and applies the same value logic to all companies.