Several interesting observations can be drawn from the weekly Relative Rotation Graph (RRG) of world stock markets, below. The first and most important finding is the long, deteriorating tail for Hong Kong’s Hang Seng Index (HSI). This market is weakening fast relative to our benchmark, the MSCI World Index, and recently entered the lagging quadrant in the bottom-left corner of the chart.
In contrast, the tail for the India’s Nifty 50 (NIFTY) is moving up, travelling deeper into the chart’s leading quadrant and making gains against both axes.

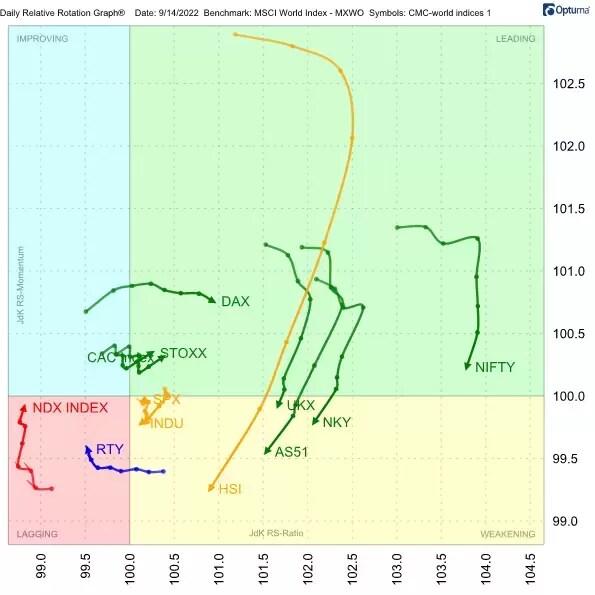
The third observation to make is the contrast between US and European markets. This is best illustrated by the rotation of the tails for the S&P 500 (SPX) and Europe’s Stoxx 600 index (STOXX). The SPX tail is inside the leading quadrant but rolling over and heading towards the weakening quadrant. In contrast, the Stoxx’s tail has recently curled up inside the weakening quadrant and is now moving back towards the leading quadrant.
Daily RRG shows Hang Seng weakening
The daily RRG for our group of stock indices supports the observations outlined above. Again, the HSI tail stands out with its long move lower through the leading quadrant and into weakening.
Here, the NIFTY tail is losing relative momentum but it is happening at a very high reading on the RS-Ratio scale, giving the Indian market enough room to complete a rotation on the chart’s right-hand side once it curls up again. Hence, this Indian index may enter a new period of relative strength after rotatng through the weakening quadrant. Also of interest are the opposing moves of the US and European indices, which this shorter-term RRG highlights.
Hang Seng set to break below previous low
The Hang Seng Index has been in a strong downtrend since the start of 2021, as the price chart below shows. During its descent, a regular series of lower highs and lower lows has formed within the boundaries of a falling channel.
The index is about to break below its previous low, which will most likely trigger another acceleration downwards. This will send the tail on our RRG even deeper into the lagging quadrant.

India’s Nifty 50 could move up in a jiffy
India’s Nifty 50 Index is pushing against the horizontal resistance level just above 18,000, as can be seen in the weekly price chart below. This week the market has broken above the slightly falling trendline that connects the last four highs.
Taking out resistance near 18,000 to the upside will confirm that a new uptrend is in force. Following such a break, we would expect to see a follow-through rally towards NIFTY’s all-time high.
This strength is captured by the RRG Lines below the price chart. The two lines are above 100 and rising versus the MSCI World Index, pushing the NIFTY deep into our RRG’s leading quadrant.

Scanning the markets for ideas
Using specific characteristics unique to Relative Rotation Graphs, we can try to find potential trading ideas by scanning a large universe of stocks.
One element that we always look for in our charts is the RRG-Heading on a tail. When a tail travels at an RRG-Heading between 0-90 degrees – in other words, in a north-east direction – the stock is gaining in terms of relative strength and relative momentum. This signals relative strength that is pushed up by increasing momentum.
A second element is RRG-Velocity. This is the distance between the observations on the tail. The longer the length, the stronger the move. We therefore pay close attention to increasing RRG-Velocity.
Finally, at this stage, we are scanning for potential long trades, which means we need stocks that may go up in price. To find those, we added the requirement that a stock must trade above its 10-day moving average.
So, to sum up, we are looking for stocks that:
1. Have rotated into a 0-90 degree RRG-Heading
2. Have increasing RRG-Velocity over two periods
3. Are trading above their 10-day moving averages
From January 2000 to January 2020, there were over 16,000 occasions when these three criteria were met by stocks in the FTSE 350 index. The graph below shows the average relative returns for all these occurrences in the 15 days following the match. All returns are measured against the FTSE 100 index. So, when a stock drops 1% in those 15 days but the index drops 2%, it will be recorded as a 1% positive return.
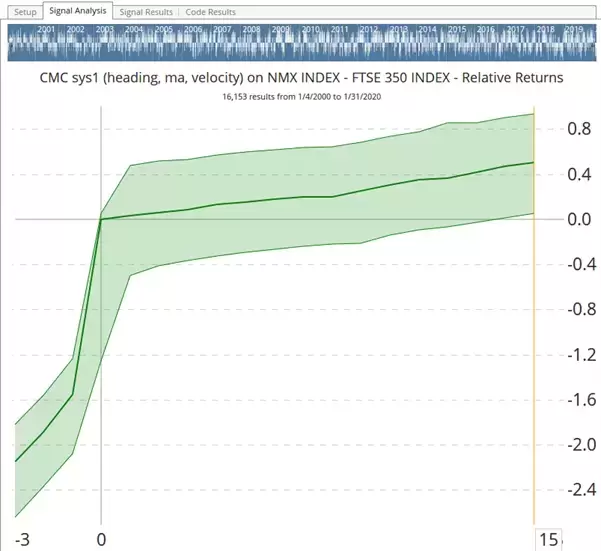
This is called a trade-signal test. The most important takeaway from this test and the results is that a positive return is expected when these criteria are met.
The next step is regularly scanning the universe for these criteria to find potential trade candidates. The results from such a scan can then be plotted on a RRG for closer inspection, alongside checks of the price chart for the particular stock.
Running this scan after the close on Thursday 15 September 2022 brought up these six names:
- ENT: Entain Plc
- JAM: JP Morgan American Investment Trust Plc
- MNKS: Monks Investment Trust Plc
- NETW: Network International Holdings Plc
- PAGE: Page Group Plc
- TUI: TUI AG
When plotted on a RRG, they looks like this:
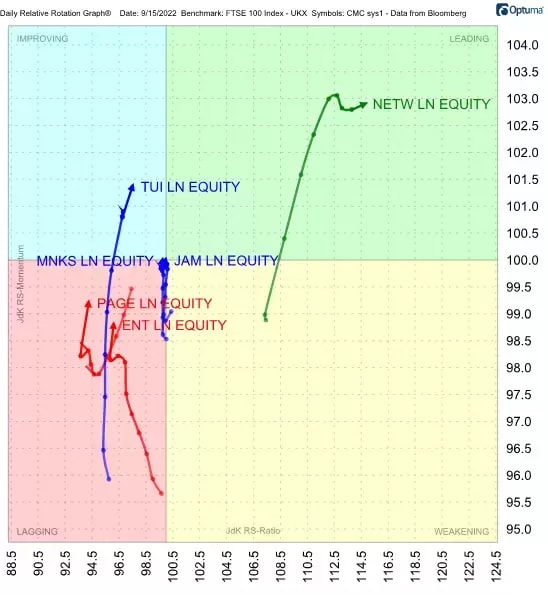
The two tails that immediately stand out are NETW and TUI. Let’s now take a closer look at these two stocks.
NETW up 25% in the past month
Electronic payments company Network International Holdings [NETW] is about to break above overhead resistance around 300. As this overhead barrier was created almost a year ago and has been tested four times as resistance, a break above it could potentially trigger an upward acceleration with plenty of upside potential.

Struggling TUI could be poised to rebound
Travel company TUI’s [TUI] chart paints a very different picture. TUI recently bottomed out around 120, which is now a critical support level. It is important to know that this is happening at the end of a prolonged downtrend for TUI, which traded as high as 450 in March 2021.
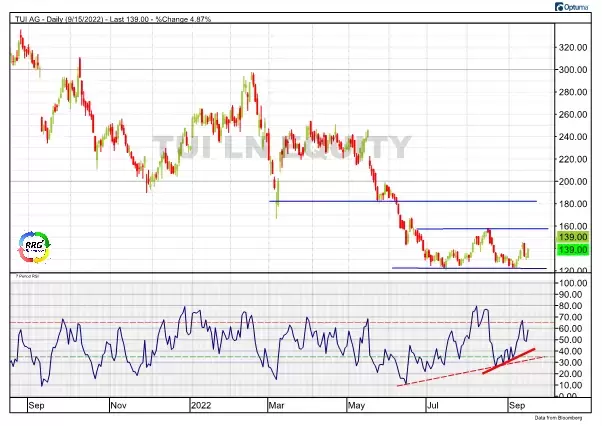
From July onwards, a trading range can be determined between 120 on the downside and 160 on the upside. A positive divergence is visible in the relative strength indicator (RSI) in the lower part of the above image – this usually signals at least a pause in the existing downtrend, but often preludes a reversal.
With the price still stuck between the boundaries of the trading range, a rally towards the top of that range appears likely, based on the RSI divergence and the solid relative strength.
If TUI can clear 160 to the upside, it’s possible that we could see further acceleration towards the next barrier around 180.
Pricing is indicative. Past performance is not a reliable indicator of future results. RRG’s views and findings are their own and should not be relied upon as the basis of a trading or investment decision.
Disclaimer: CMC Markets is an execution-only service provider. The material (whether or not it states any opinions) is for general information purposes only, and does not take into account your personal circumstances or objectives. Nothing in this material is (or should be considered to be) financial, investment or other advice on which reliance should be placed. No opinion given in the material constitutes a recommendation by CMC Markets or the author that any particular investment, security, transaction or investment strategy is suitable for any specific person. The material has not been prepared in accordance with legal requirements designed to promote the independence of investment research. Although we are not specifically prevented from dealing before providing this material, we do not seek to take advantage of the material prior to its dissemination.


