The gains made by US stock indices over the past three months may be nearing an end. Since 1 March, the S&P 500 has risen more than 6% to close at 4,205.5 points yesterday, while the Dow Jones has risen just over 1% to 33,042.8 points during the same period.
The remainder of this week could bring a modest upward move, but our analysis – which draws on Elliott Wave theory and cyclical factors – suggests that the market might be approaching a precipice.
S&P 500 faces mounting downside risk
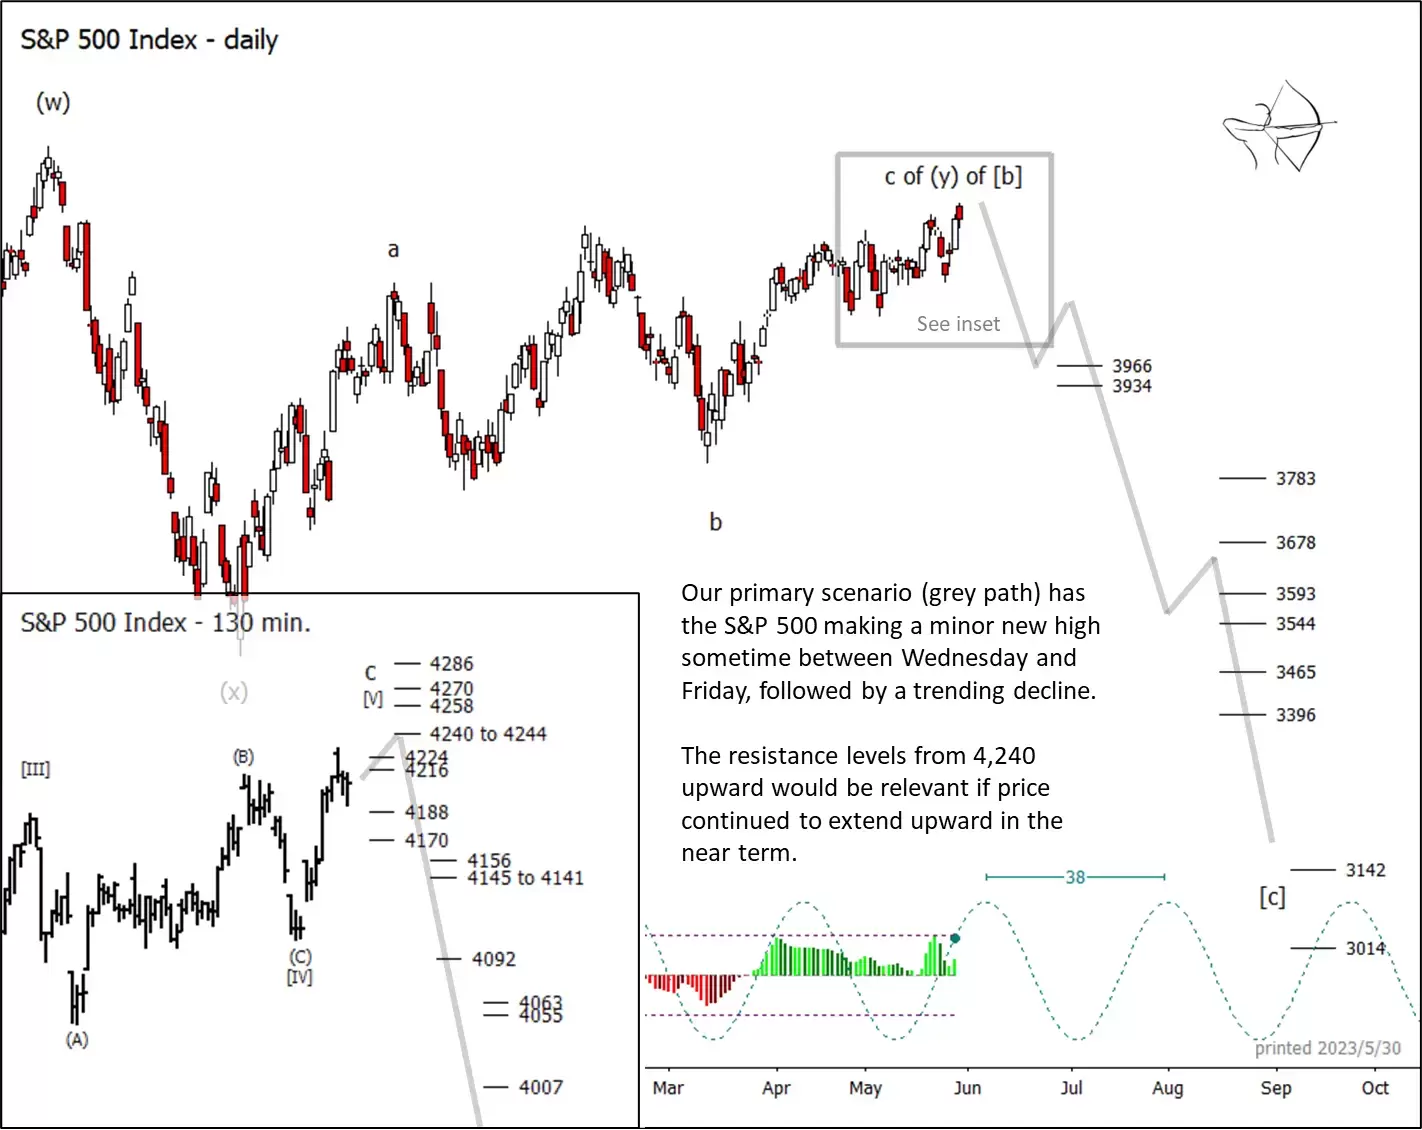
The S&P 500 intraday chart, shown in the inset below, would look better with a minor new high over that of Tuesday. However, the downside risk for the index appears increasingly dire, so traders are likely to be keeping close tabs on their long trades this week and next. Market conditions could soon start to favour short trades.
It's also possible that the S&P 500 completed its ascent on Tuesday, in which case we'd watch the retracement resistance levels at 4,216 and 4,224 for a reaction.
If the minor support at 4,170 breaks and a decline starts gaining traction, then the first major support zone waits near 3,966 and 3,934.
Dow already dipping
Compared to the S&P 500, the Dow Jones Industrial Average has shown much less upward momentum this year. It appears to be rolling away from the lower high it printed on 1 May, suggesting that any upward move this week should be treated as a retracement.
Overhead resistance lies near 33,250 and 33,430 as shown on the intraday chart. The first major support zone for the Dow sits near 31,310 and 31,080.
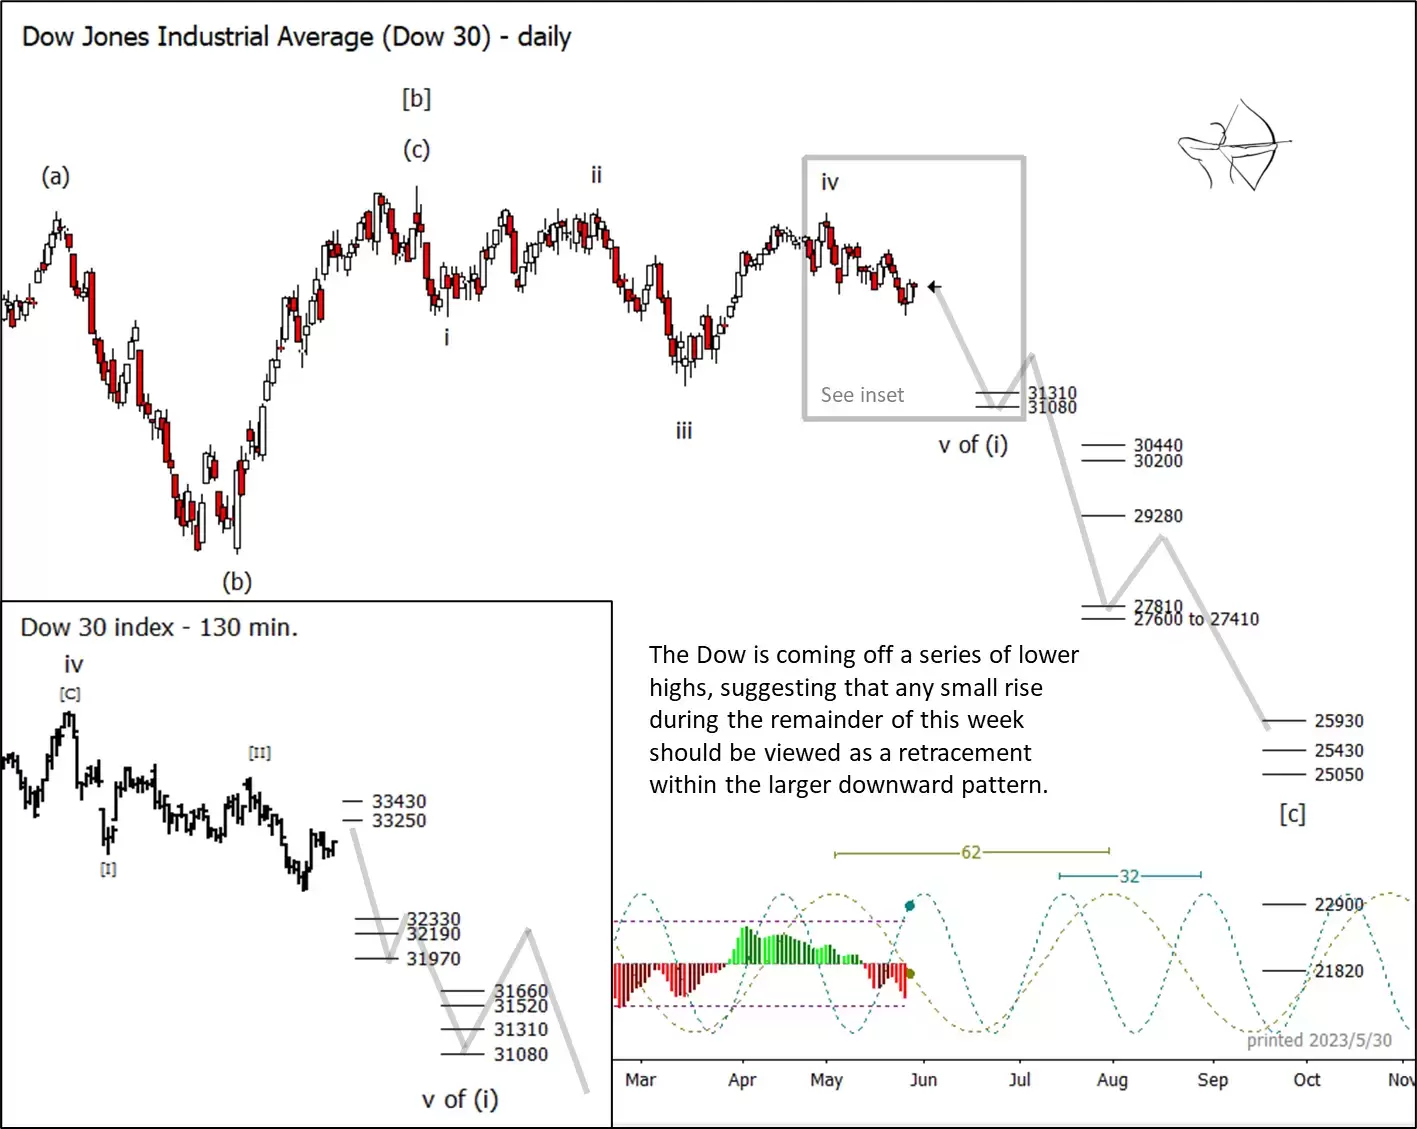
Both the S&P 500 and the Dow Jones are approaching inflections of their medium-length cycles shown in blue on the charts. With the Dow, the slower 62-day cycle already seems to be lending an advantage to bears.
For more technical analysis from Trading On The Mark, follow them on Twitter. Trading On The Mark's views and findings are their own, and should not be relied upon as the basis of a trading or investment decision. Pricing is indicative. Past performance is not a reliable indicator of future results.
Disclaimer: CMC Markets is an execution-only service provider. The material (whether or not it states any opinions) is for general information purposes only, and does not take into account your personal circumstances or objectives. Nothing in this material is (or should be considered to be) financial, investment or other advice on which reliance should be placed. No opinion given in the material constitutes a recommendation by CMC Markets or the author that any particular investment, security, transaction or investment strategy is suitable for any specific person. The material has not been prepared in accordance with legal requirements designed to promote the independence of investment research. Although we are not specifically prevented from dealing before providing this material, we do not seek to take advantage of the material prior to its dissemination.


