In this week's video update, I highlight the continued clear split between rotations for markets that travel at a negative, south-west RRG-Heading, and those travelling at a positive, north-east RRG-Heading.
Germany and Europe Dominate RRG
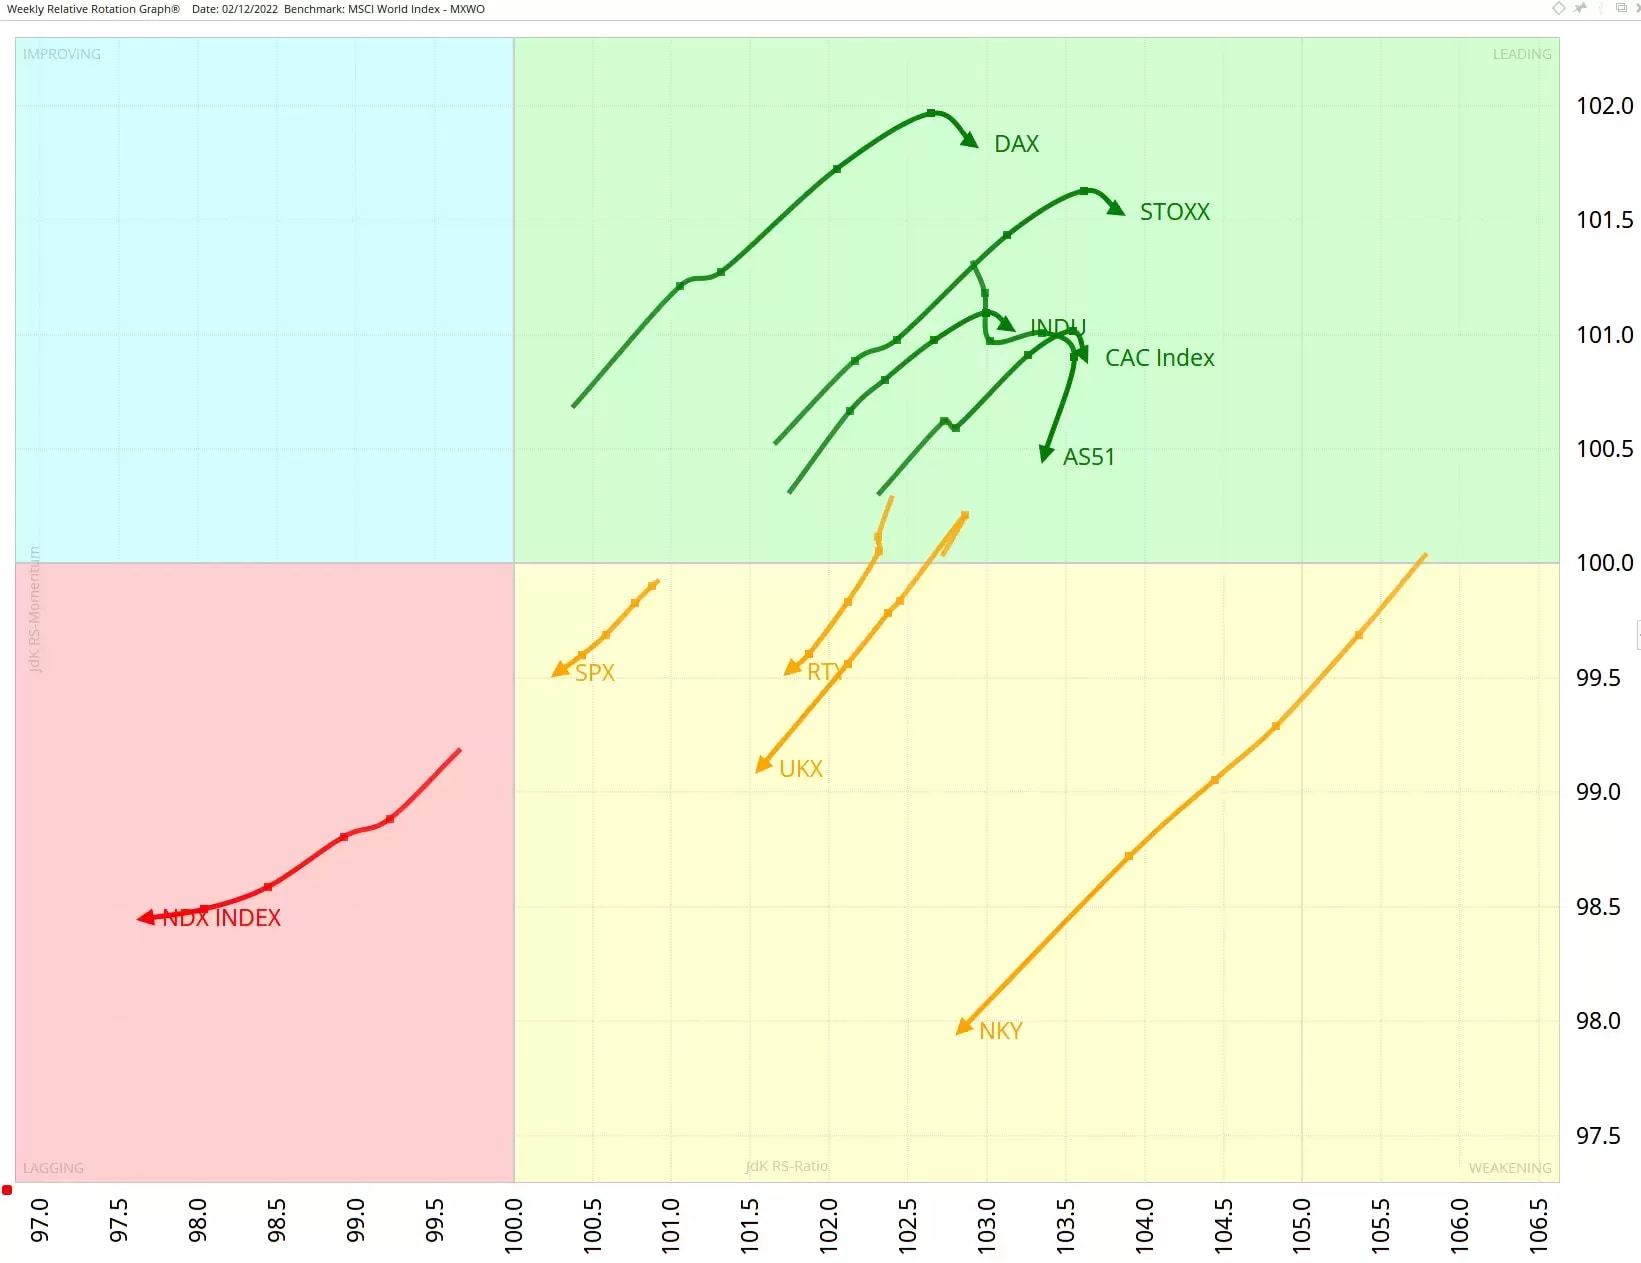
In this weekly MSCI world and major indices chart, the markets showing strong rotations towards and into the leading quadrant remain primarily European. The highest and further to the right are the DAX and STOXX indices.
On 22 November, Julius ran our scan that looked for short-term opportunities. The date column tells us on what date the conditions were met.
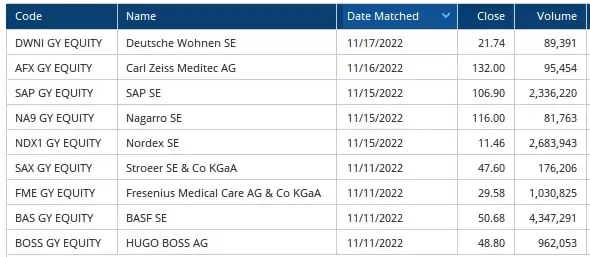
Studying the price charts that belong to these tails, Julius found three stocks with strong upward potential.
Stroeer SE & CO KGaA [SAX]
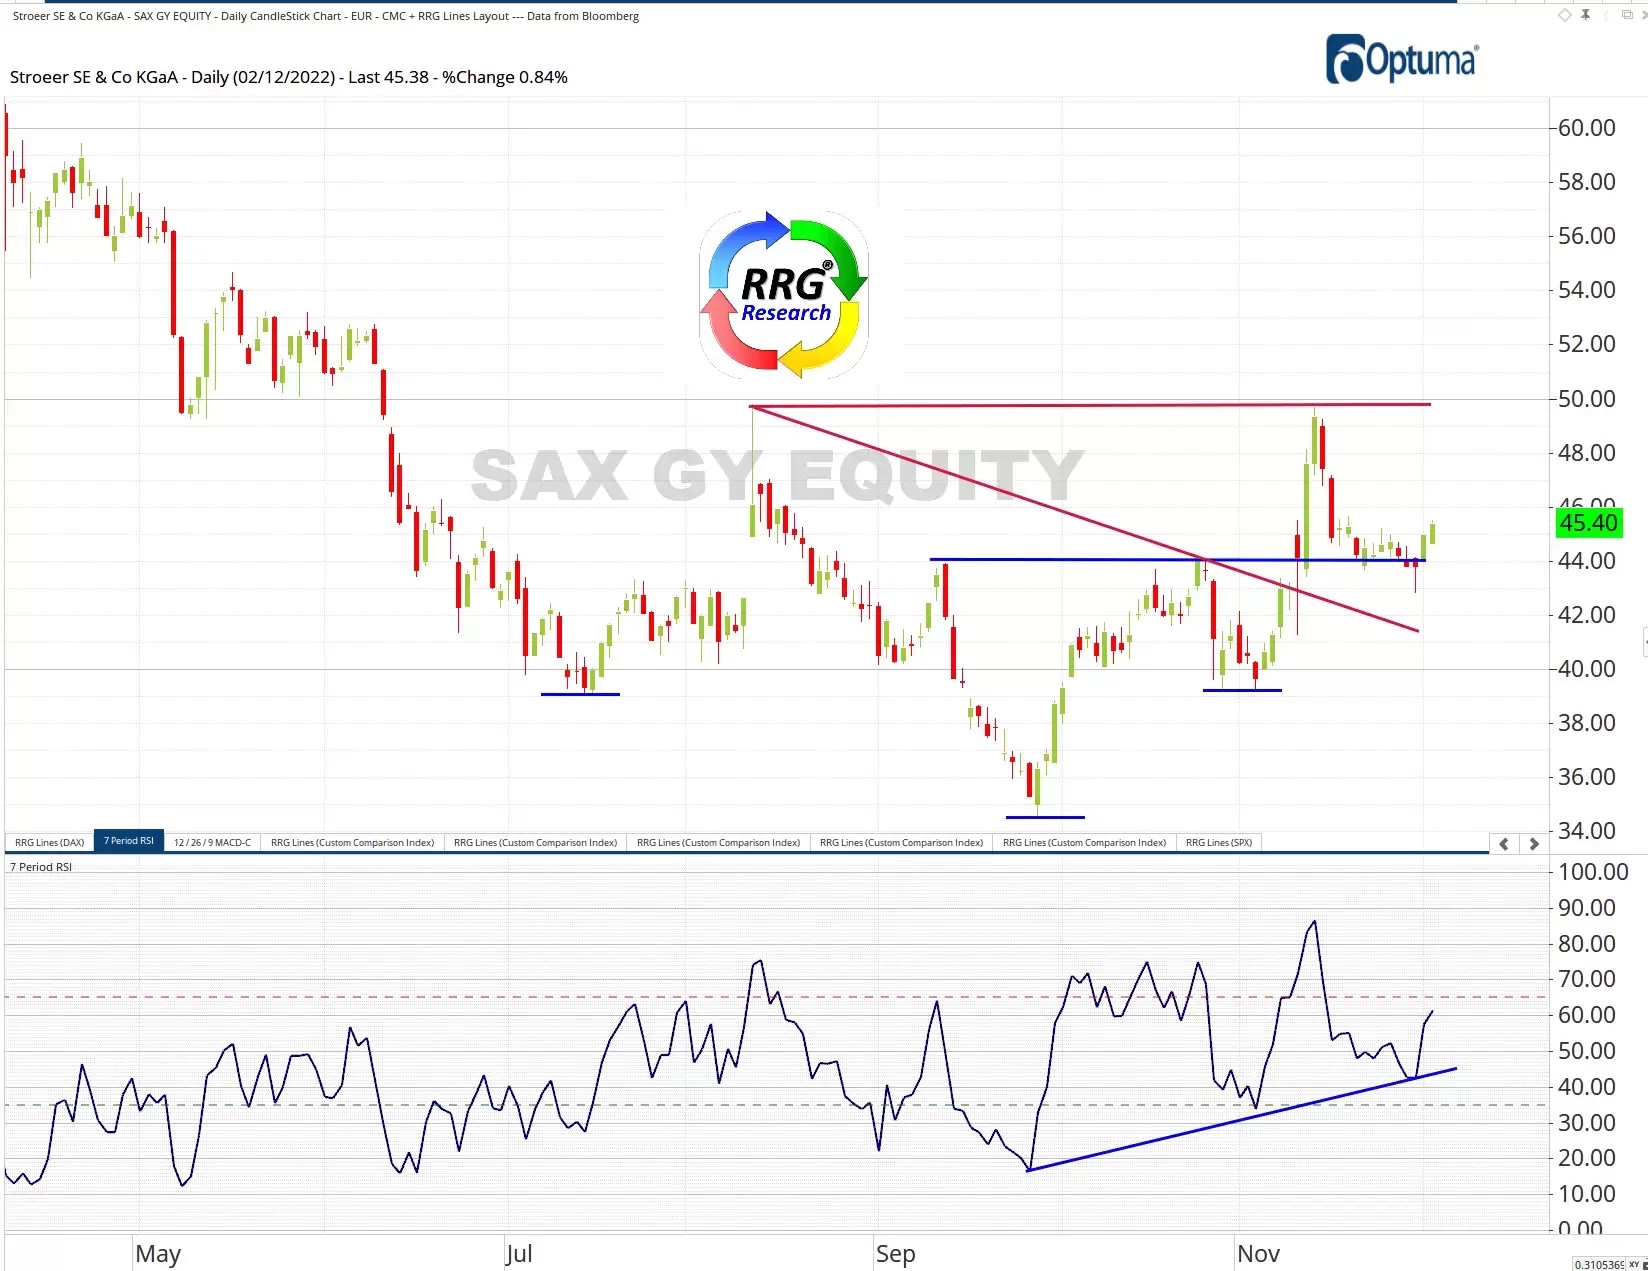
SAX fell for most of the year. It made a low in July, a lower low in September, reaching a low of around 35, and then a later low in September just below 40. Low, lower, low and higher low spells a reverse head & shoulders pattern, if the neckline is broken. Strictly speaking, the neckline is drawn from the high above the left shoulder and the head and the high between the head and the right shoulder. This (red) line was broken early this month, and prices shot through resistance, but price action was rebuffed by resistance at the round number, and the July high of 50. The price then fell back to support at 44 when SAX came up on the RRG scan of German stocks.
Julius said: This setup provides us with an excellent risk-reward opportunity. As long as this support level holds, the initial upside potential is for a move back to the barrier near 50, which means around 10% upside potential. A break back below 45 negates that setup. If 45 can also be taken out to the upside, even more potential for a further rise will be unlocked.
The price has started to lift after a short consolidation. With the same caveat of 45 holding, the return to rising prices looks to be starting, and a higher low looks to have been established. 50 is a clear objective and resistance.
Nordex SE [NDX1]
Nordex peaked above 26 in April this year and was supported way down at 7.5 in July. After this big fall, NDX1 rallied towards resistance at 11 from May. There was a second test of that 7.5 support at the end of September.
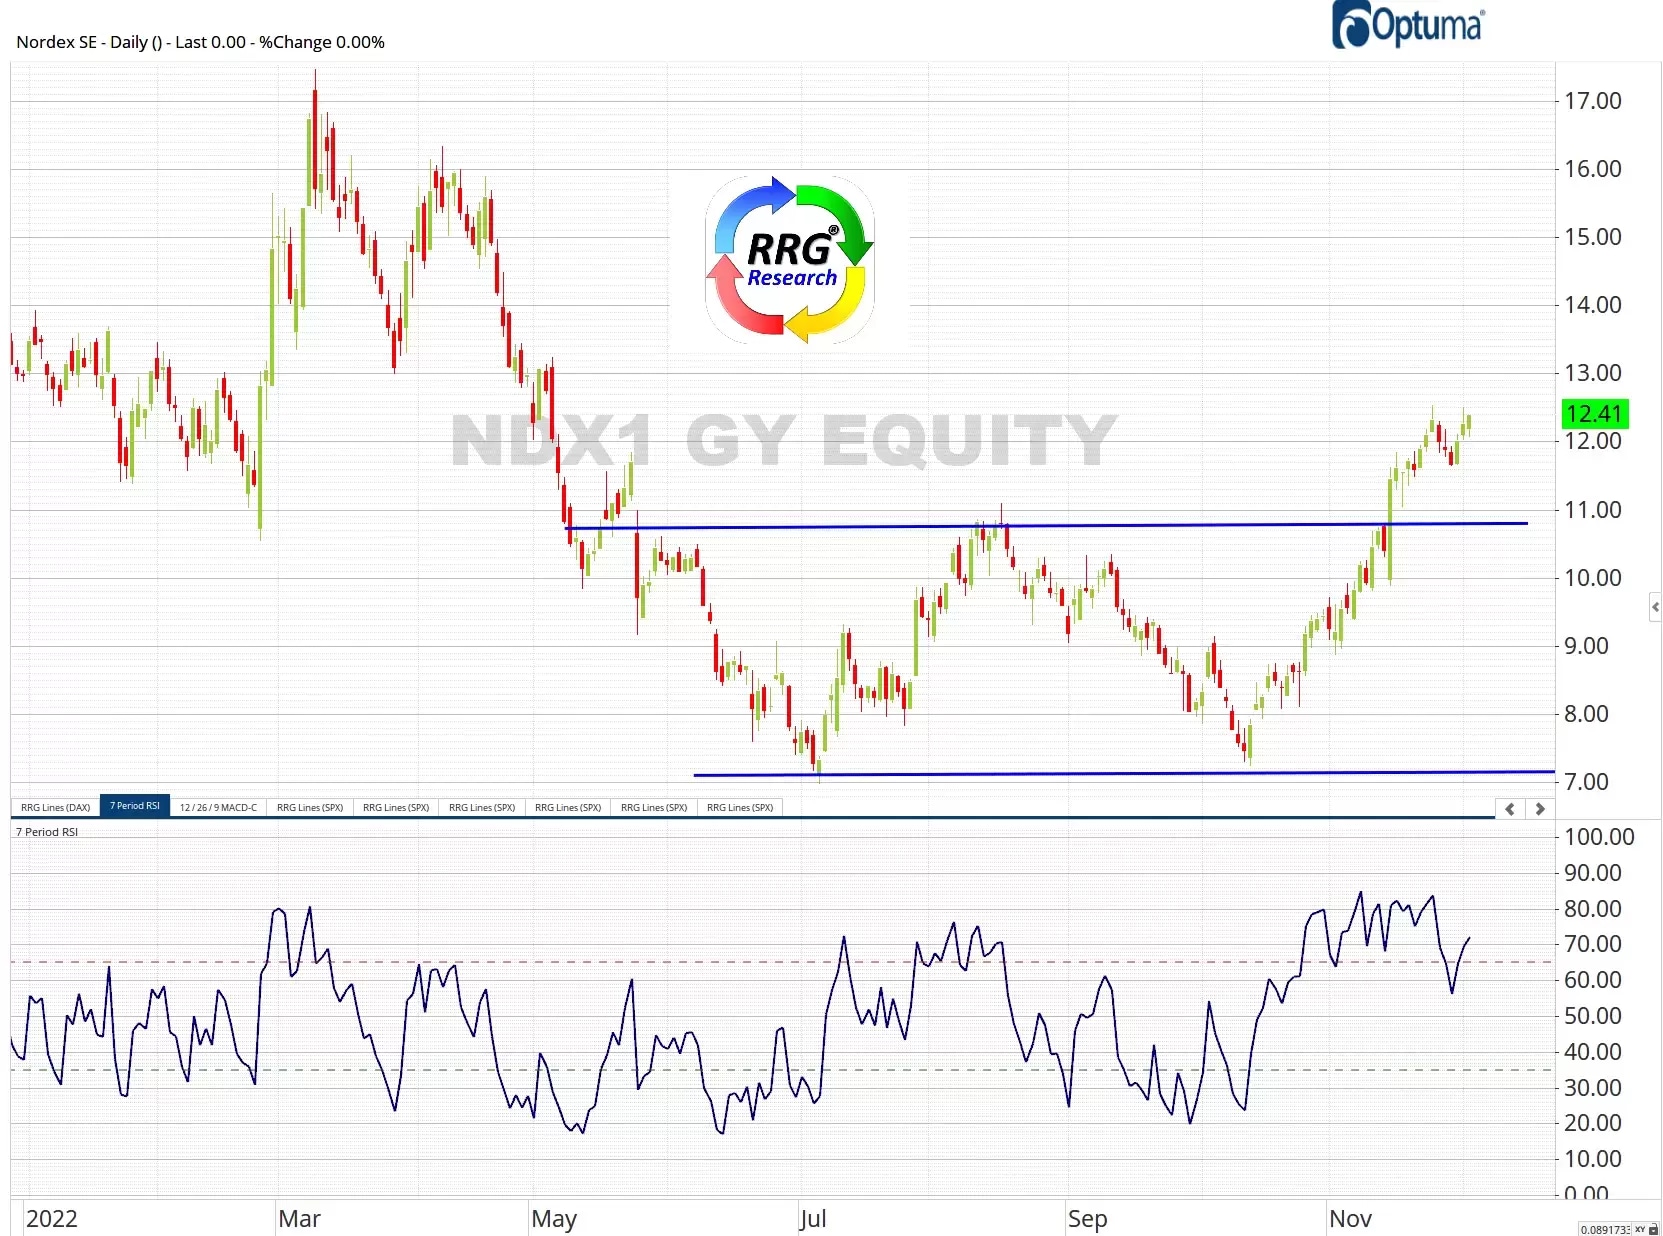
NDX1 has rallied strongly out of that support and broke the horizontal barrier near 11. When we have a low after a long downtrend, a rally, a retest of the low, and a breakthrough the rally high, we have a double bottom pattern. Counting from the two lows and 7 to the pullback high at 11, and adding the difference (4) to the pullback high, we get a minimum price objective of 15. The is consolidation resistance and a resistance high of 11.5 in between. Dropping back into the 11-7 range would negate this setup.
Nagarro SE [ NA9]
Nagarro's stock price has more than halved since it started the year at 210, but, but as Julius suggested two weeks ago, the tide is now turning.
The bottom formation in September completed below that trendline shows an inverted head & shoulders reversal pattern. The characteristic head and shoulders are marked with blue support lines, and the neckline connects the two in-between highs. Taking out that neckline was the first signal of the reversal. The subsequent move above the long-term falling resistance line will confirm the turnaround is underway.
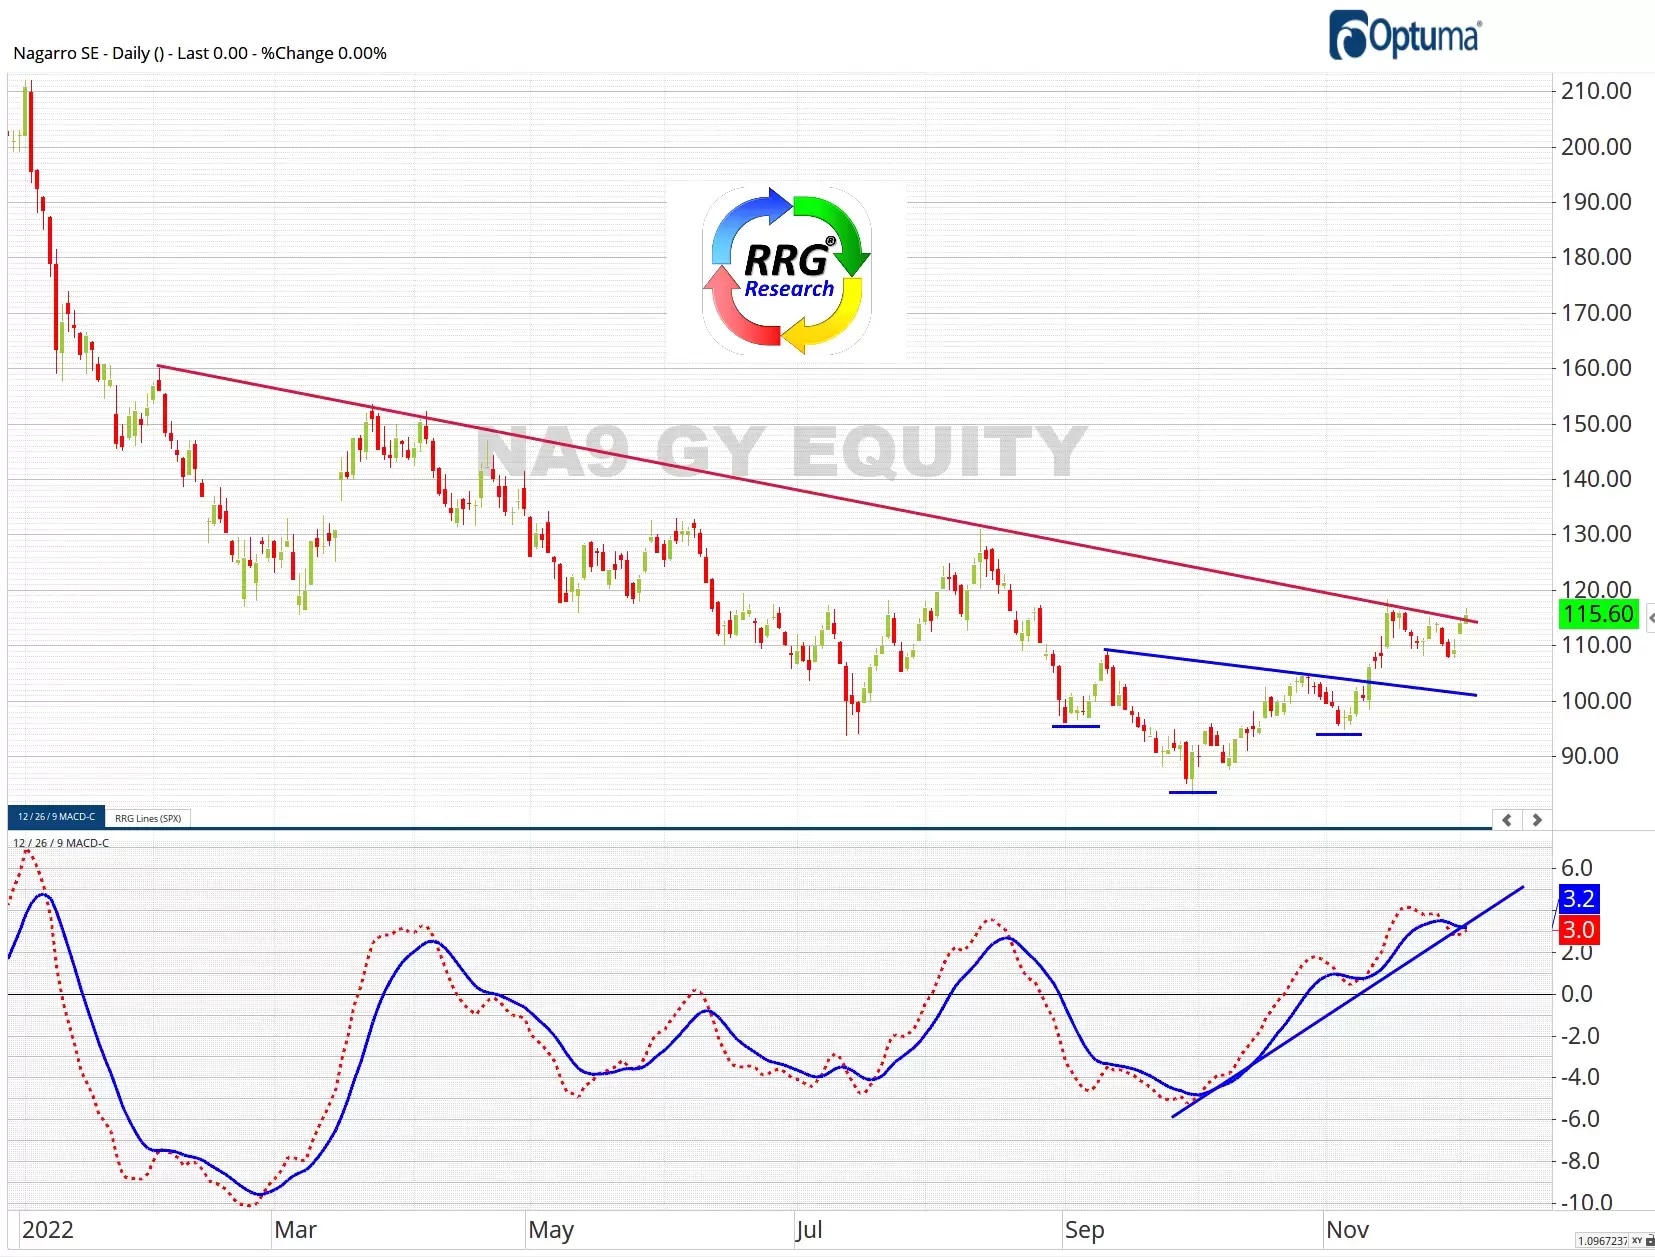
The chart above shows that a major long-term falling resistance is being tested right now, and the momentum is good.
Based on the H&S reversal formation, a first target can be determined at around 125, while the next significant resistance level is near 130. The stock looks to have healthy upward potential, with limited downside risk back to the level of the falling resistance line, which should now start to act as support.
Pricing is indicative. Past performance is not a reliable indicator of future results. RRG’s views and findings are their own and should not be relied upon as the basis of a trading or investment decision.
Disclaimer: CMC Markets is an execution-only service provider. The material (whether or not it states any opinions) is for general information purposes only, and does not take into account your personal circumstances or objectives. Nothing in this material is (or should be considered to be) financial, investment or other advice on which reliance should be placed. No opinion given in the material constitutes a recommendation by CMC Markets or the author that any particular investment, security, transaction or investment strategy is suitable for any specific person. The material has not been prepared in accordance with legal requirements designed to promote the independence of investment research. Although we are not specifically prevented from dealing before providing this material, we do not seek to take advantage of the material prior to its dissemination.

