The Nasdaq 100 and Dow Jones forecasts that we made almost three weeks ago have performed fairly well. This article updates those bearish paths and considers how the two indices could – with the benefit of hindsight – have been traded.
Nasdaq 100 down 5.3% in the past month
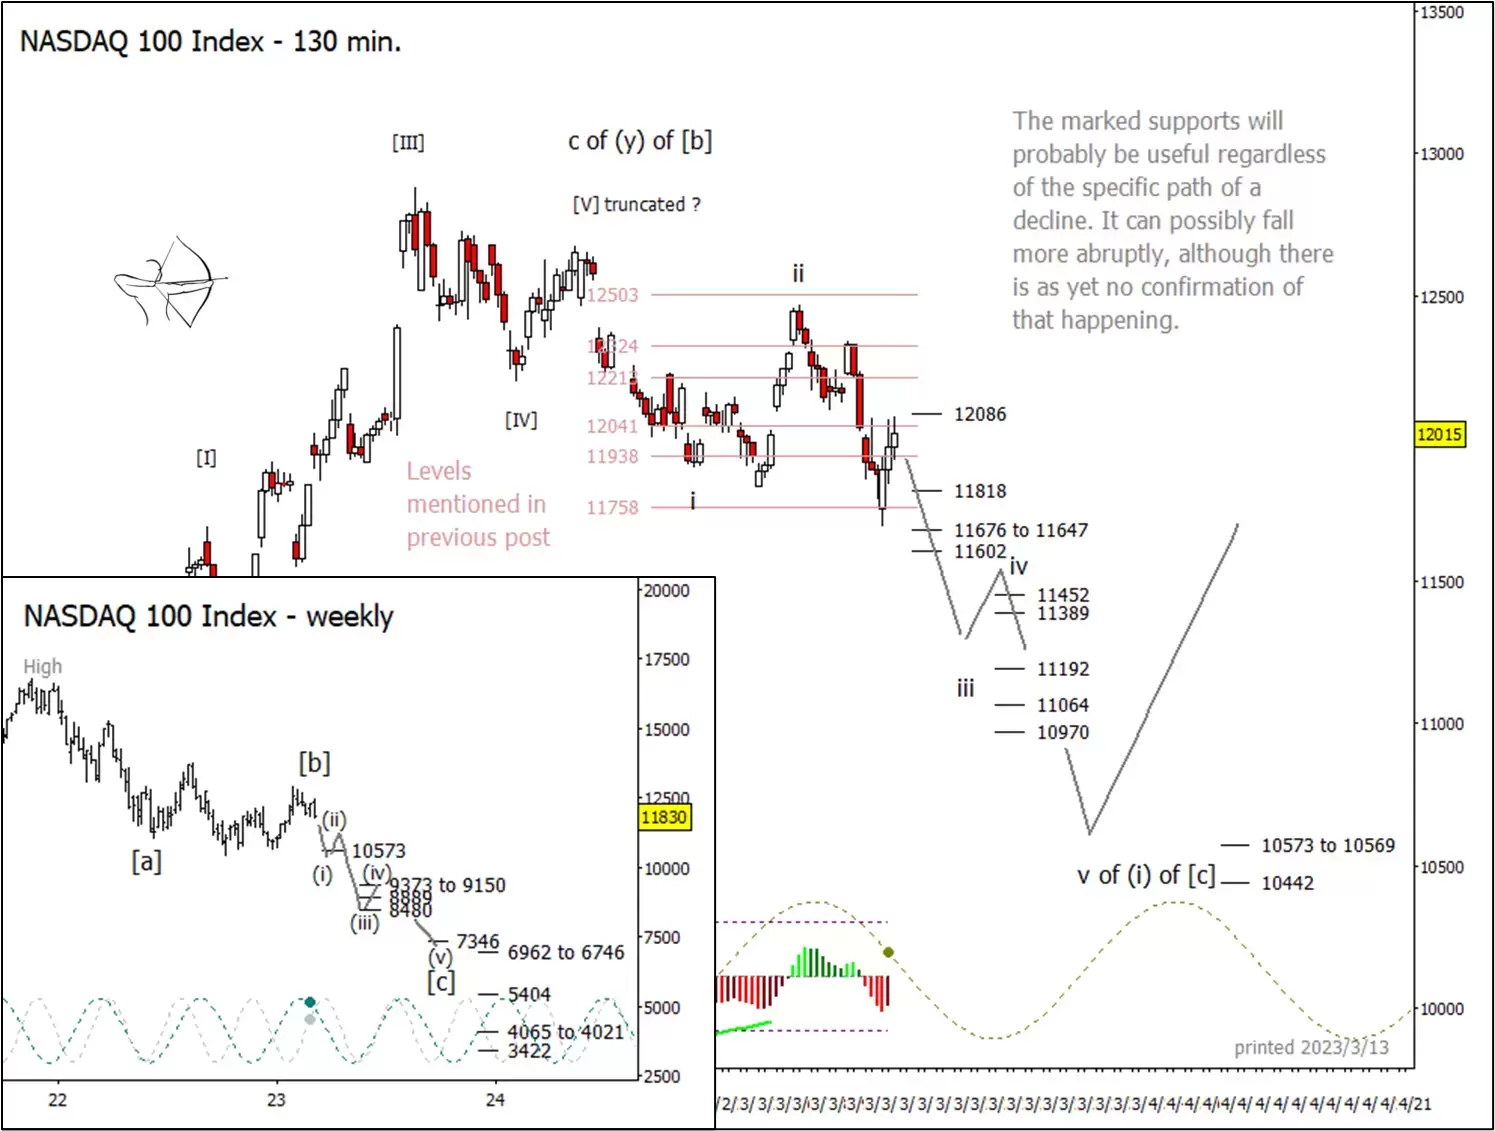
Soon after our 23 February article, the Nasdaq 100 tested and then dropped through our initial target support level. It would have been a reasonable intraday strategy to go long upon successive tests of the first support at 12,041 points with appropriate stops, exiting at the first resistance area. A similar but more risky strategy would have worked after the first level failed. When price bounced the next day and formed an ‘island’, it should have alerted wave-counting traders that a new pattern segment was underway.
As price climbed in wave ii, it noticed and then skipped above the middle resistance target at 12,324 which could have served as an exit point for intraday bulls. Those who favour slower trades might have begun watching for objective signs of a downward turn at or after the cusp of wave 'ii'.

In the next few days, the Nasdaq 100 could make a strong ‘middle third’ wave. It’s possible that wave 'iii' could extend more forcefully than our path line suggests. The marked support levels will probably be relevant even if price breaks further or faster than is shown in the chart above.
If price were to climb above 12,086, we would need to revise our short-term wave count.
We have June or July as a preliminary target for the end of the entire decline. Another window for a possible low, or a higher low, emerges around October.
Dow down 6.7% since 14 February
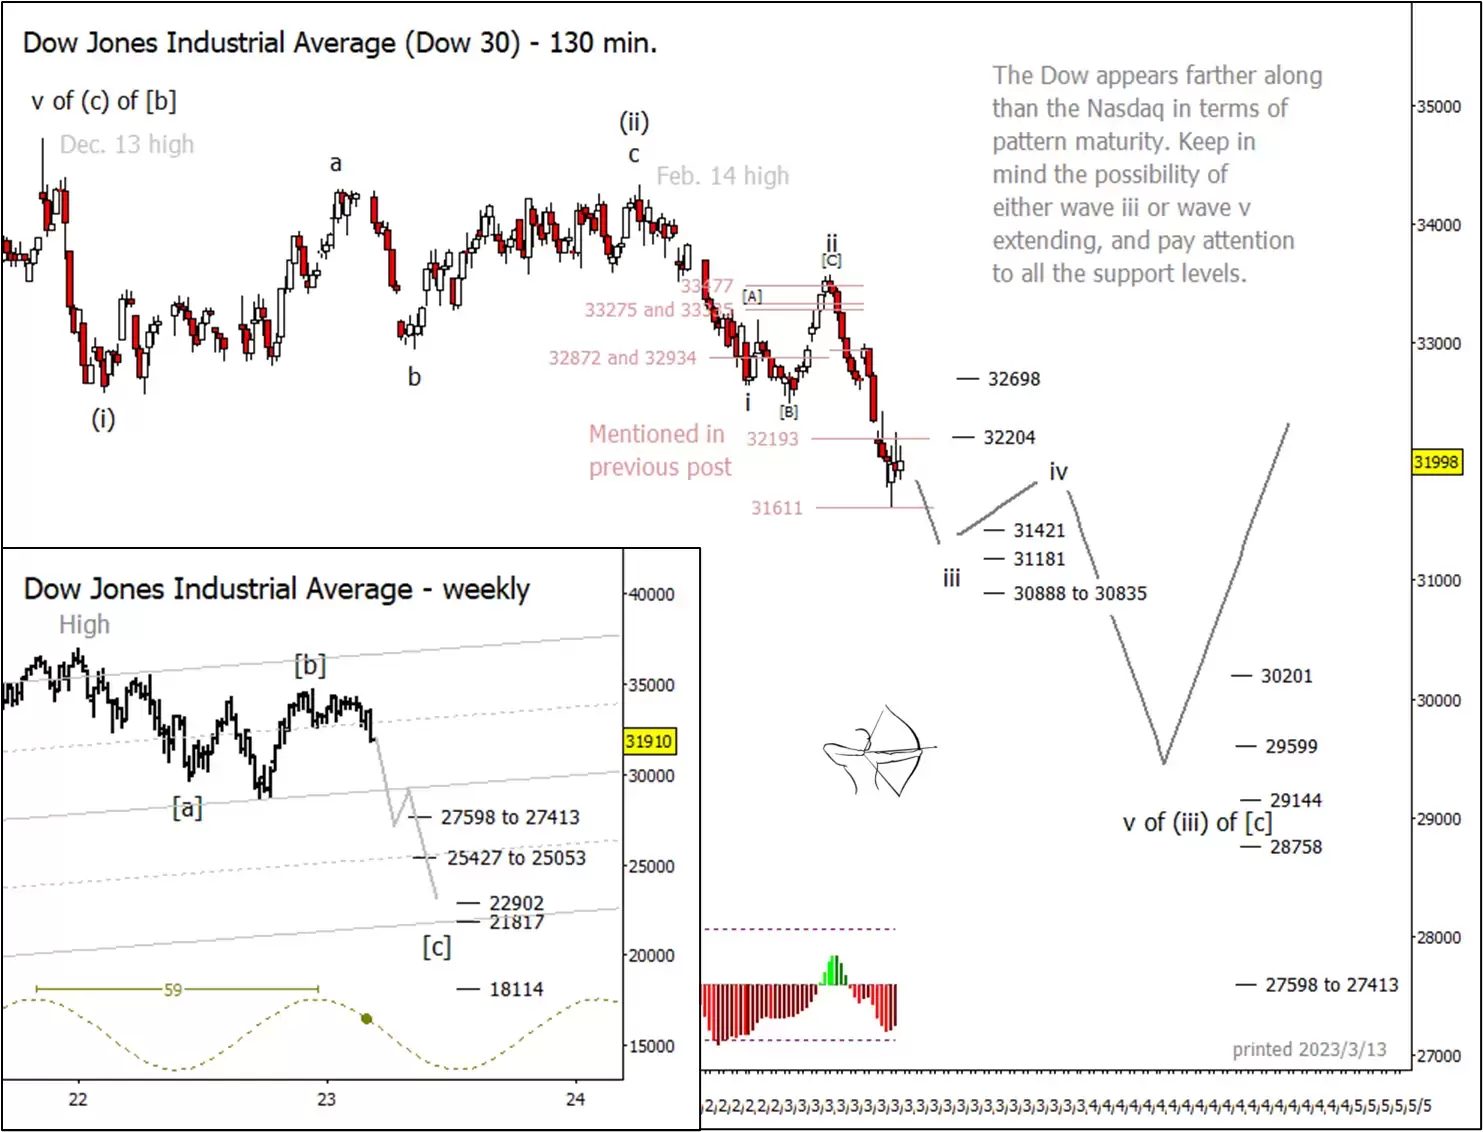
The Dow Jones Industrial Average has been weaker than the Nasdaq recently. That doesn't necessarily mean its downward path will be more forceful. It's merely at a different part of its pattern. Perhaps a small wave [IV] could test the range between 32,193 and 31,611 points. If price breaks above that range, it may not spend much time above 32,698.

As with the Nasdaq, it's possible that the Dow might fall through supports more rapidly than the path shown above. The lower price levels should remain relevant even if they are tested early in the pattern.
For more technical analysis from Trading On The Mark, follow them on Twitter. Trading On The Mark's views and findings are their own, and should not be relied upon as the basis of a trading or investment decision. Pricing is indicative. Past performance is not a reliable indicator of future results.
Disclaimer: CMC Markets is an execution-only service provider. The material (whether or not it states any opinions) is for general information purposes only, and does not take into account your personal circumstances or objectives. Nothing in this material is (or should be considered to be) financial, investment or other advice on which reliance should be placed. No opinion given in the material constitutes a recommendation by CMC Markets or the author that any particular investment, security, transaction or investment strategy is suitable for any specific person. The material has not been prepared in accordance with legal requirements designed to promote the independence of investment research. Although we are not specifically prevented from dealing before providing this material, we do not seek to take advantage of the material prior to its dissemination.


