The world’s financial markets could be on the verge of a turnaround. Bond yields are falling, the US dollar is depreciating, liquidity is increasing, and emerging markets are experiencing a bull run. Is a new record high for the DAX a realistic scenario in 2023?
Bonds bottoming out
The first piece of the puzzle has already been put in place: 10-year US government bonds have formed a 123-low; in other words, they’ve formed a bottom. The low of the recovery impulse from the end of October for 10-year US T-notes of $108.83 to $111.96 was defended at the beginning of November, as there was no new low. Rather, the price exceeded the impulse high at $111.96, forming a 123-low (bottom formation) in the daily chart. In chart terms, the possibility for falling interest rates is set above $111.96; below this price a reassessment of the situation would have to be made.
From the extracts of traders' futures trading books published by the US Futures and Options Commission (CFTC), we can see that speculative market participants created a record short position on 2-year US government bonds at the end of November . So, if there is a decline in short-term interest rates and a rally in 2-year government bonds, this could trigger a short squeeze. Extreme values in trading books’ statements on US futures exchanges, also known as a "commitment of traders", are seen by investors as a possible counter-cyclical signal.
The US Federal Reserve could pause in spring 2023 to wait for the medicine it has administered to the market to take effect. The ECB could follow with a time lag. In fact, 10-year German government bonds have not yet formed a bottom. This would require a jump above €141.88. As long as the Euro Bund remains below this level, we cannot assume that a bottom has been formed, but rather the downward trend remains intact.
Bottom line: The bottoming of US T-notes is the first step towards a signal of falling interest rates, even though the ECB will probably only be able to implement a turnaround with a time lag, and after the US central bank.
EUR/USD bottoms out
The euro has reached a long-term price target at $1.0049. This target is calculated by the 61.8% Fibonacci extension of a 123 top that formed in 2008, until 2014. The starting point for the trend reversal formation was a downward impulse from $1.60 to $1.23 in 2008. The high at $1.60 wasn’t undercut again, and a lower low below $1.23 was formed in December 2014. The first Fibonacci price target has now been reached. These long-term price projections can be the starting point for major trend changes in markets, as investors shift positions and EUR/USD short sellers cover their short positions.
Indeed, a 123-low can be detected in EUR/USD in the weekly interval, with the initial impulse ranging from $0.95 to $0.99. The end of the impulse was exceeded in the week ending 5 November, creating a 123-low. From a chart perspective, a signal for a possible weaker US dollar has been set in EUR/USD, as long as the currency pair remains above $0.99.
Liquidity increases
Triggered in particular by a repeated easing of credit conditions in China, including the lowering of the key interest rate there, we have seen an improvement in global liquidity since the beginning of October. The global money supply briefly fell below $96tn in early October, but grew again to $98.2tn by the end of November. Since spring 2022, the global money supply has fallen sharply from just below $104tn, thanks to the synchronous tightening of monetary policy by virtually all global central banks. A countermovement in the money supply could lead to a resurgence in investor risk appetite. It could also ease the tightening of US dollar assets, causing the US dollar to depreciate against other world currencies.
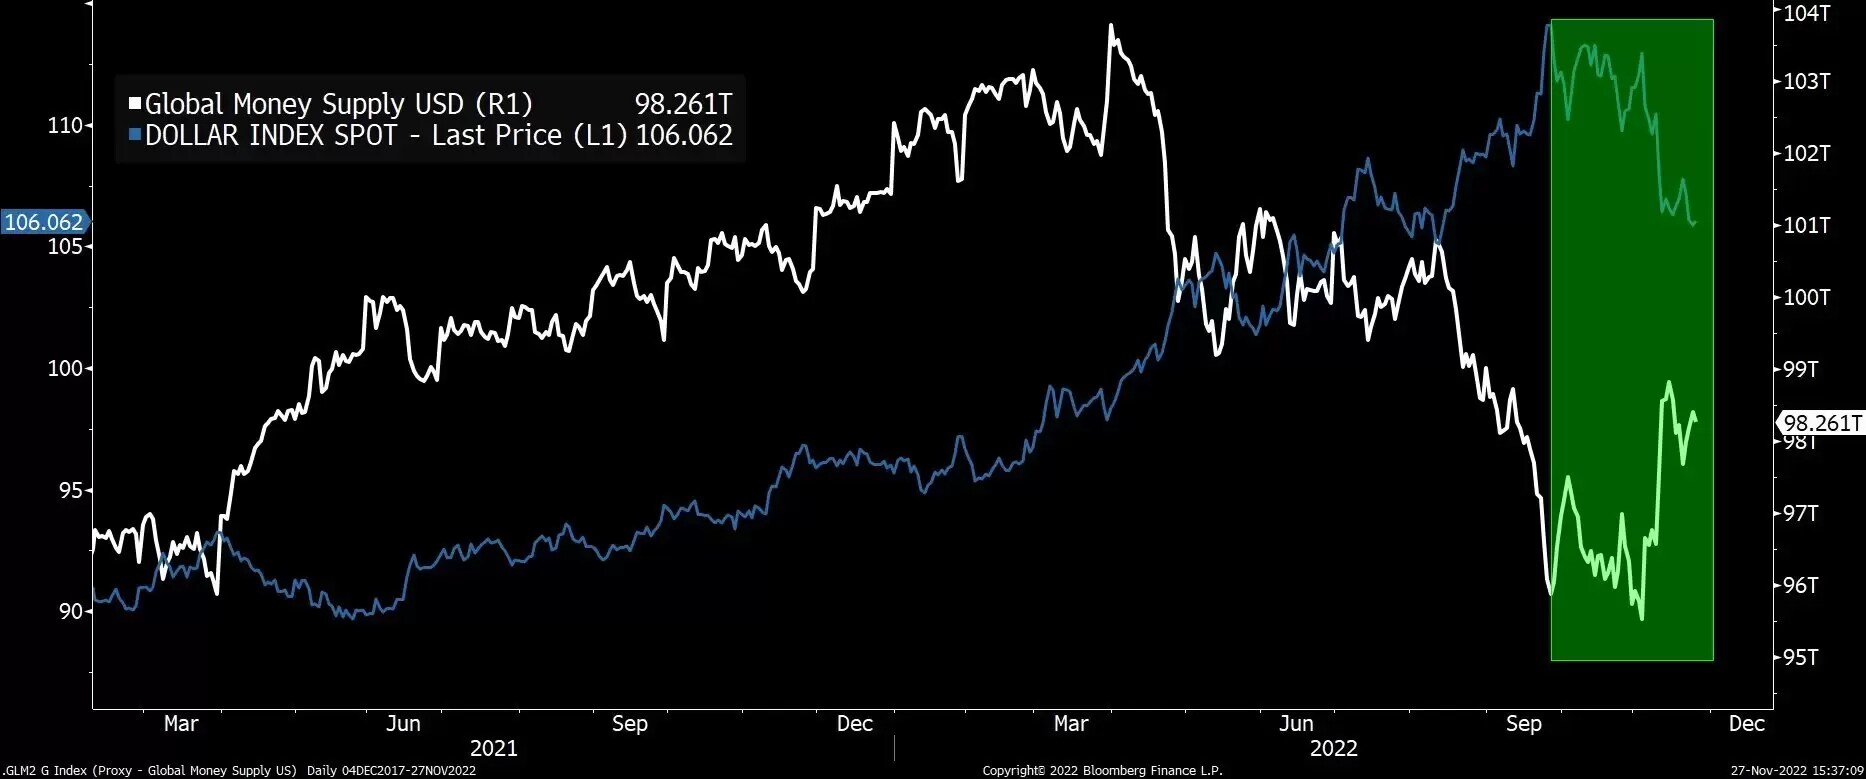
The Federal Reserve could make its first rate cut later in 2023 if credit conditions deteriorate, particularly in the junk bond space. Until this happens, it could be a good time for equities. But if the Fed does cut rates then, it could be interpreted as an admission that the risk of a financial crisis has grown. This could cause equities to plummet again, and raise fears about new deflationary dangers. So, the next three to six months may be ‘Goldilocks time’ for global equity markets.
Emerging markets react positively
In a period of economic growth (outside a recession), falling interest rates and a falling US dollar may indicate that capital is being reallocated from the core of the currency area (developed countries) to high-growth emerging markets. On 29 November, India's benchmark Nifty 50 index rose to a new record high. Other stock indices in emerging markets could follow. Later, western stock indices could also set new historical records – including the DAX, S&P 500, and Nikkei 225.
What’s next for Germany 40 after rally from seasonal low?
The Germany 40 formed a low at 11,811 points on 3 October, perfectly in line with the seasonal pattern. On average over the last 15 years, the seasonal low in the Germany 40 is 3 October – and this year was no exception. The seasonal low was the starting point for a rally of around 864 points. The consolidation that followed this rally did not bring a new low below the low of 3 October. Rather, the price rose to a new high on 18 October, completing a bottom pattern. Since then, the index has risen by over 23%.
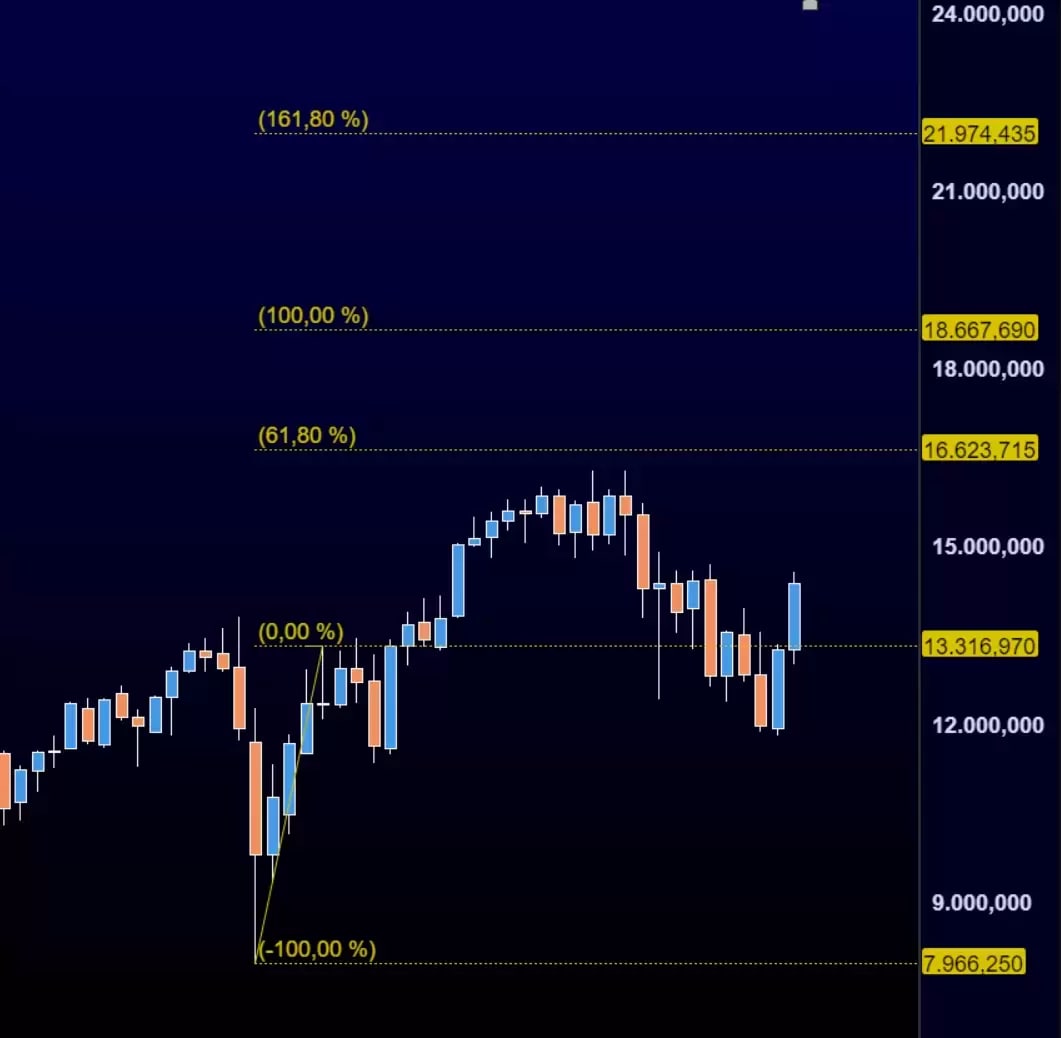
Overarchingly, the rebound above 13,316 points represents a reactivation of a 2020 trend continuation pattern, whose first Fibonacci extension is at 16,623 points. A monthly close above 16,623 points could activate the next extension target at 18,667 points, then at 21,974 points. A monthly close below 13,316 points should be avoided. This would be seen as questioning the rally-readiness of the index.
What’s in store for the US SPX 500 index?
The US SPX 500 has formed a so-called broadening wedge pattern from February 2020 to January 2022. A monthly close above the all-time high formed in January 2022 would activate a price target from this broadening wedge on the chart, which would be a whopping 7,428 points. This is also the 261.8% Fibonacci extension from a trend continuation formation that the index formed in 2020, and which has been confirmed by the correction since the beginning of the year.
However, if there is no close above the all-time high at 4,817 points, the October 2022 low could be undershot by the end of the month. This could activate an alternative possible price target that can be derived from the broadening wedge. This lies at just under 1,000 points in the index. Even a monthly close below 3,558 points could put question marks behind the index's ability to resume its rally to the upside. Unrest and volatility could increase significantly in such a scenario.

The bottom line
We may be in for a strong period in the equity market, with a continuation of the rally first in emerging market indices, and then in the developed market equity indices. This rally is based primarily on the fact that the recession, which has been signalled by the US bond market for weeks by an inversion of the yield curve, is not yet visible in the actual data currently reported. Until that happens, a strong phase could dawn for stock markets
Disclaimer: CMC Markets is an execution-only service provider. The material (whether or not it states any opinions) is for general information purposes only, and does not take into account your personal circumstances or objectives. Nothing in this material is (or should be considered to be) financial, investment or other advice on which reliance should be placed. No opinion given in the material constitutes a recommendation by CMC Markets or the author that any particular investment, security, transaction or investment strategy is suitable for any specific person. The material has not been prepared in accordance with legal requirements designed to promote the independence of investment research. Although we are not specifically prevented from dealing before providing this material, we do not seek to take advantage of the material prior to its dissemination.
