The S&P 500 has ended the day higher just twice since 23 November. Put another way, 10 of the last 12 trading days have seen the index fall. These declines occurred as the market worked off the overbought conditions that had developed prior to this period.
A bull might argue that the index is down only 2% over this period (or down 4% from the November high), so things could be worse. However, I would contend that we’re still in the middle of a correction and the path towards oversold conditions is likely to be zig-zagged, rather than straight down.
The pullback from overbought conditions is seldom smooth. The decline between April and June this year saw the market take a breather in mid-April, move sideways in early May and rally in late May. Similarly, the decline between August and early October involved a mid-August respite and a decent oversold rally in early September.
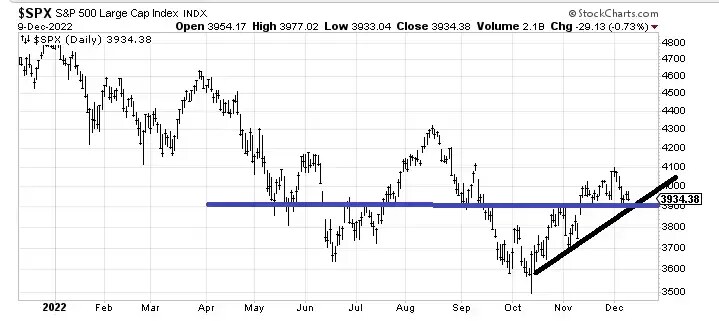
On the above chart I have drawn a short-term uptrend line that comes in at 3,900. Since April, the 3,900 level has acted like a magnet – when the index has dropped under that level to the point of being oversold, it has rallied; when it has risen above that level to the point of being overbought, it has pulled back.
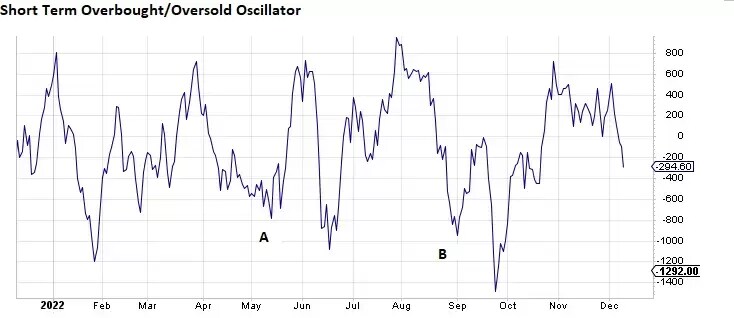
The S&P 500 may hold 3,900 on its current descent, just as it did in late May and early September. The short-term overbought/oversold oscillator, shown below, indicates that the index is heading deeper into an oversold condition, but remains above the levels that it hit in mid-May (labelled A on the chart) and in early September (B).
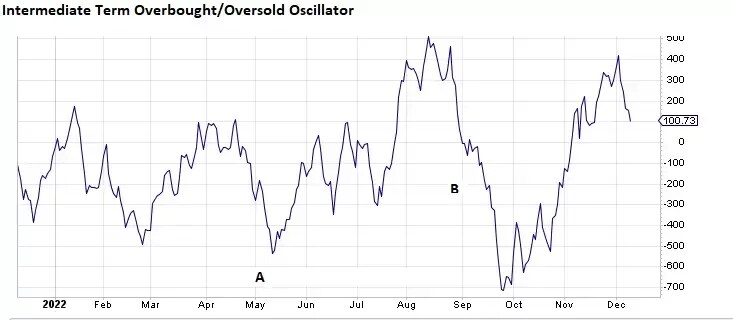
The intermediate-term oscillator, below, is giving a reading of around 100, putting it in overbought territory. Note how low the line fell in May (A) and September (B).
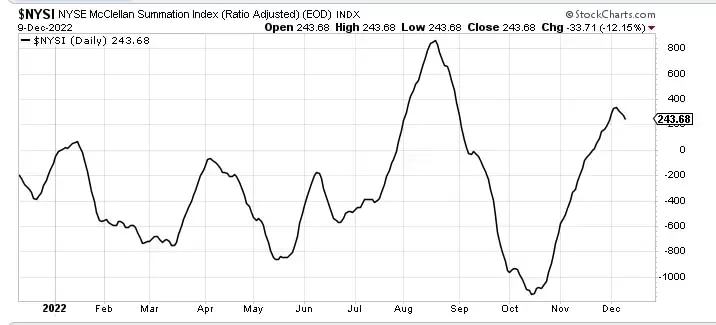
Last week, the McClellan Summation Index – a long-term indicator of bullish or bearish bias in the stock market – peaked and began to fall, as can be seen in the chart below. When the index is rising, the market has a better chance of reversing pullbacks; when it is heading down, the downtrend can continue if the market is not sufficiently oversold.
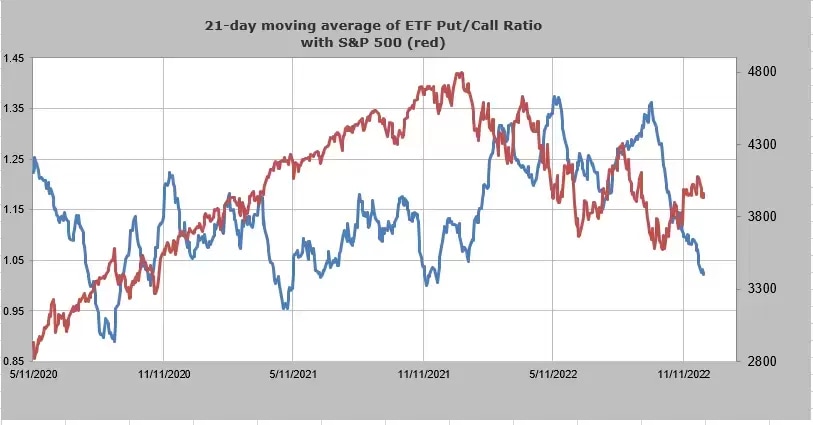
Sentiment would perhaps be more bearish at the moment if it weren’t December, when investors look for seasonal factors, such as the so-called Santa Rally, to lift the market. The 21-day moving average of the put/call ratio for ETFs, shown below, is now the lowest it has been since November 2021. Each time the put/call ratio (the blue line) has dropped below the 1.0 area, the market has corrected. As mentioned above, the S&P 500 is down about 4% from its late November high. In the last two years, the smallest correction we have seen has been just over 5%. That doesn’t mean we can’t stop at 4%. But because the market is not sufficiently oversold, the correction could have further to run.
Finally, a word on oil. Energy has been one of the best-performing stock market sectors in 2022. Until early November, energy was also the most over-owned group. Energy stocks have since corrected (and are likely to correct further in the next month or so), but today let’s look at the price chart for West Texas Intermediate (WTI) crude oil, the US benchmark. There is a lot of support around $65-70 a barrel, as the chart below illustrates.
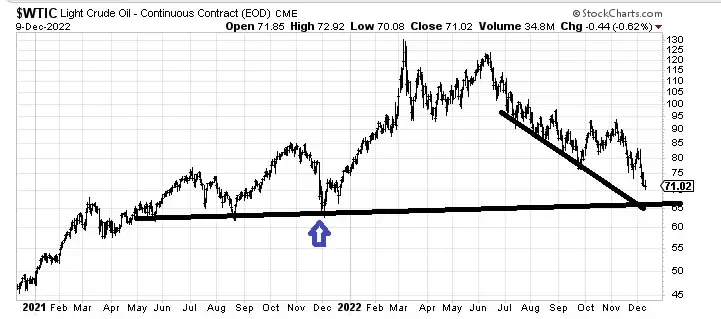
The Daily Sentiment Indicator (DSI), which moves on a scale of 0 to 100, is now at 20, down from a peak of more than 90 in June. Readings over 90 tend to be seen as a ‘sell’ level, while readings under 10 are often viewed as a ‘buy’ level. If WTI crude falls to $65, the DSI reading could drop into, or close to, the buy zone. The blue arrow on the chart shows the last time we had a DSI reading of 20.
The author's views and findings are her own, and should not be relied upon as the basis of a trading or investment decision. Pricing is indicative. Past performance is not a reliable indicator of future results.
Disclaimer: CMC Markets is an order execution-only service. The material (whether or not it states any opinions) is for general information purposes only, and does not take into account your personal circumstances or objectives. Nothing in this material is (or should be considered to be) financial, investment or other advice on which reliance should be placed. No opinion given in the material constitutes a recommendation by CMC Markets or the author that any particular investment, security, transaction or investment strategy is suitable for any specific person. The material has not been prepared in accordance with legal requirements designed to promote the independence of investment research. Although we are not specifically prevented from dealing before providing this material, we do not seek to take advantage of the material prior to its dissemination.


