US oil benchmark West Texas Intermediate (WTI) and gold could make strong moves over the coming weeks, our analysis suggests. Although each market is in a different phase of its pattern, we believe the two commodities could hit durable lows by July or August.
Is the price of gold on its way down?
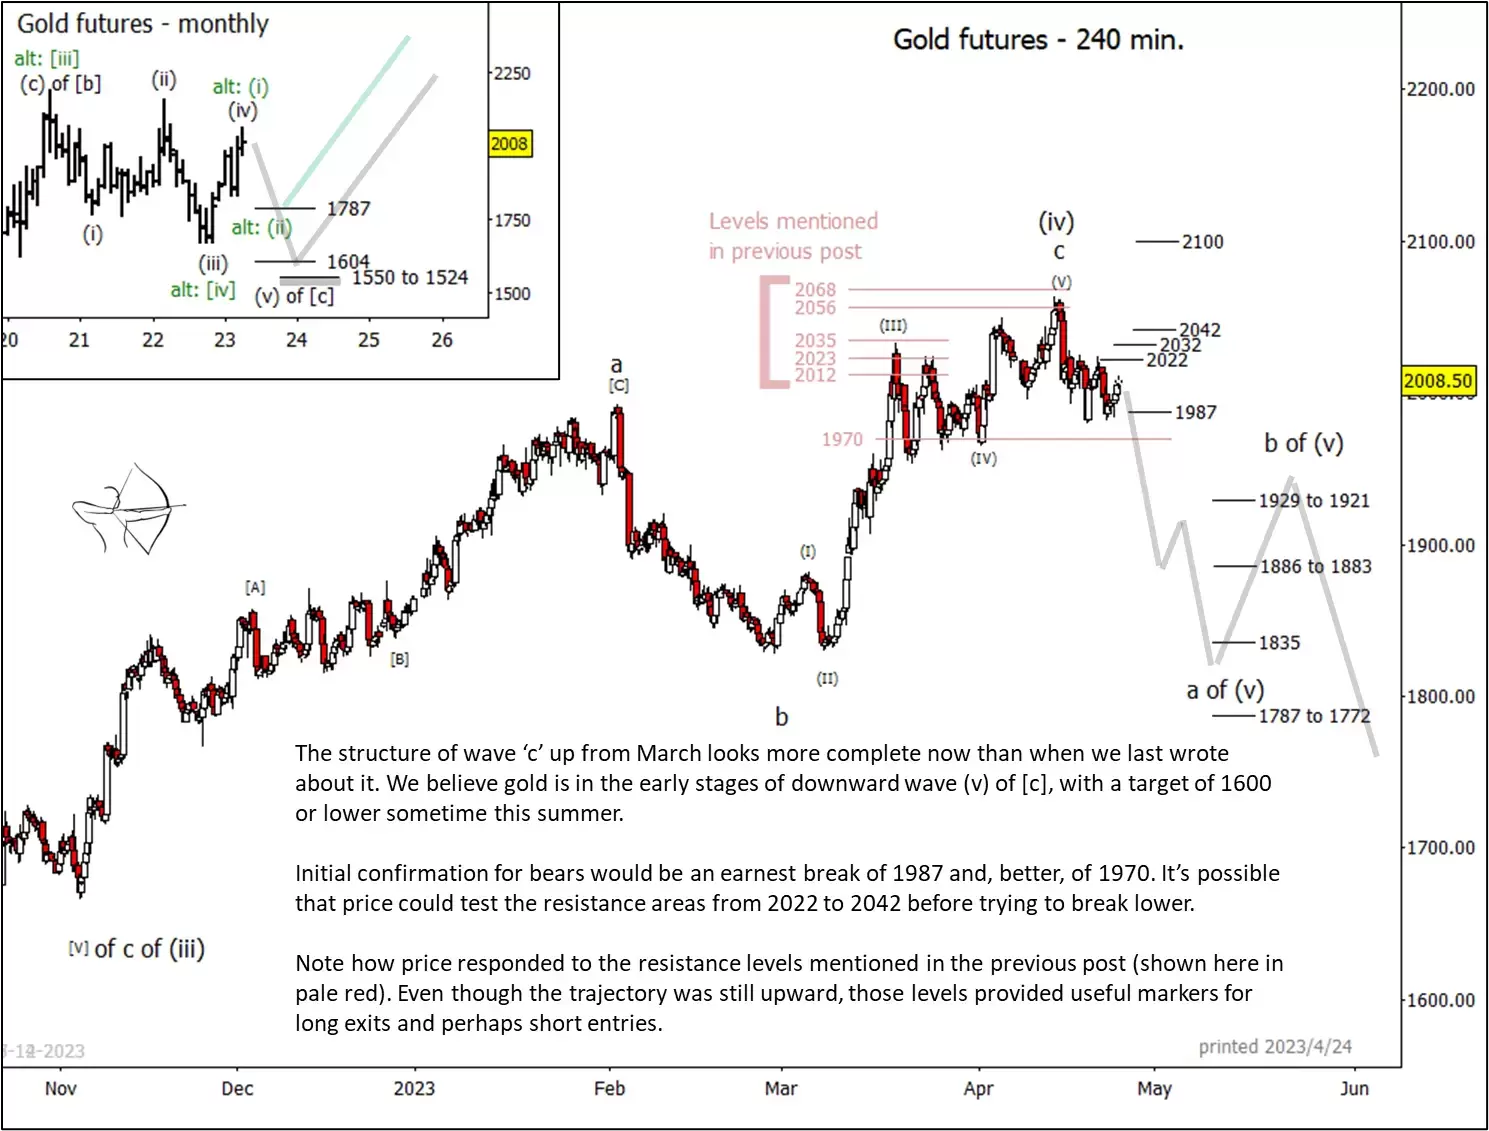
While Gold climbed considerably higher than we were expecting when we wrote about it on 21 March, the structure of upward wave 'c' of (iv) looks well defined now. A reversal may have already begun. A break of supports at $1,987 and $1,970 an ounce might serve as initial confirmation for bears.
A failure of support at $1,970 could provoke a fairly rapid descent in wave 'a' of (v) to the middle area of supports near $1,886, $1,835, and $1,787. From there, traders should be alert to the possibility of a substantial bounce in wave 'b'. In our alternative scenario, that bounce could continue upward, as shown by the green line in the inset below. Either way, the market seems poised to enter a period that could catch many traders off guard.
The longer-term pattern that began in 2020 could see a new low. Our preliminary target support zones are near $1,604 and $1,550. As Elliott Wave traders will be aware, a wave 'II' low often precedes a strong wave 'III' rally. The pattern we're labelling as a second wave has stayed within a range for three years, and a third wave should take price considerably out of that range.
In the very near term, we cannot rule out a modest rise this week to test resistance levels from $2,022 to $2,042, as marked on the main chart below. If price exceeds the mid-April high, then $2,100 might become a viable target for risk-tolerant bulls.

WTI crude oil prices could see near-term volatility
While we expect gold to start trending downwards, the price of WTI crude oil may become quite volatile during the next few weeks, albeit within a range. This environment could favour nimble intraday traders who aren't averse to entering and exiting positions quickly.
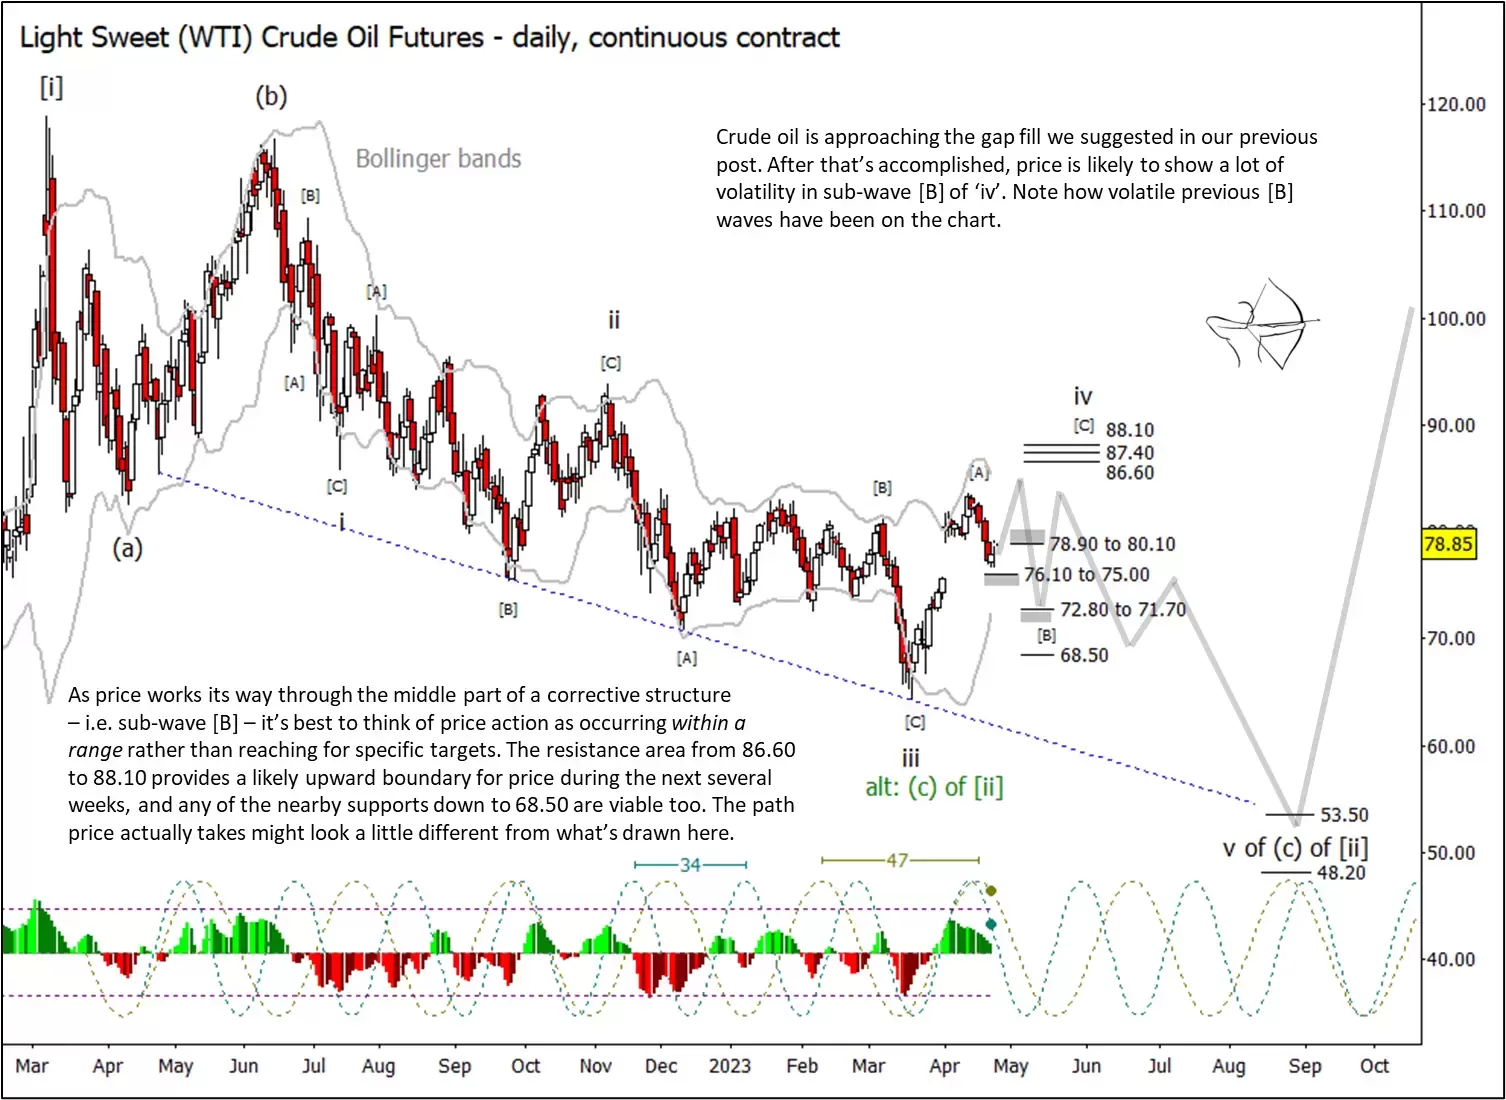
The gap fill we wrote about two weeks ago appears almost complete. After that, price could remain beneath the resistance levels marked from $88.60 to $88.10 a barrel, but the lower end of the range is harder to specify. Price could wend a complicated path among the support zones before the developing wave [B] is finished. The subsequent upwards wave [C] might at first appear to be part of the previous [B] wave structure. Wave [C] need not make a new high.
To get a sense of the volatility that may lie ahead, consider previous segments in the chart below that we have identified as [B] waves.

After a few weeks of volatile but sideways action, WTI crude oil could begin trending rapidly downwards to meet a target zone that includes $53.50 and $48.20 as possible supports.
In our primary scenarios, both WTI crude oil and gold could hit price lows at fairly similar points in time.
For more technical analysis from Trading On The Mark, follow them on . Trading On The Mark's views and findings are their own, and should not be relied upon as the basis of a trading or investment decision. Pricing is indicative. Past performance is not a reliable indicator of future results.
Disclaimer: CMC Markets is an order execution-only service. The material (whether or not it states any opinions) is for general information purposes only, and does not take into account your personal circumstances or objectives. Nothing in this material is (or should be considered to be) financial, investment or other advice on which reliance should be placed. No opinion given in the material constitutes a recommendation by CMC Markets or the author that any particular investment, security, transaction or investment strategy is suitable for any specific person. The material has not been prepared in accordance with legal requirements designed to promote the independence of investment research. Although we are not specifically prevented from dealing before providing this material, we do not seek to take advantage of the material prior to its dissemination.


